Archived article
Please note that tax, investment, pension and ISA rules can change and the information and any views contained in this article may now be inaccurate.
 magazine
Why the yen holds the key to markets and what may lie ahead

A market storm is emerging from a seemingly cloudless summer sky. The question now is whether this is just a tempest in a teapot, and the result of thin trading volumes as the big hitters head to the beach and leave deputies and juniors in charge, or whether it is the harbinger of a more serious – and bearish – shift in market sentiment.
The first step to working this out is to understand what may be upsetting markets right now. The second is to see what might influence those trends and issues, for better or worse.
TRICKY TRIO
In sum, three issues seem to be at work:
First, equity (and to some degree bond) markets have priced in the ‘perfect’ scenario of cooling inflation, a soft landing in Western economies (and thus corporate earnings) and rate cuts from the US Federal Reserve, the Bank of England and others.
Any deviation from that path could therefore lead to trouble – either stickier inflation, economic and earnings disappointment or slower-than-expected rate cuts.
Deviations from that path can be found, however. Rate cuts have come more slowly than hoped, and the Fed has yet to deliver, after the market started 2024 looking for six, one-quarter point cuts from the US central bank.
Inflation has proved stickier, and there are signs the US economy is slowing – unemployment is up, the housing market is a mess and the latest purchasing managers’ index for manufacturing showed weak orders and sticky prices.
A US slowdown is not priced in at all – if anything markets were more concerned about it overheating earlier this year – and those with long memories will remember how frantic rate cuts in 2000-02 and 2007-08 failed to stave off a bear market in stocks, because the economy tipped over and corporate earnings fell far faster than the headline cost of money.
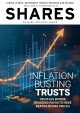
Second, the yen is rallying. As this column hinted back in February of this year, the Japanese currency has been a major source of global liquidity as major market players have shorted it, borrowed against it and used that money to go long risk assets around the globe.
The Bank of Japan’s belated efforts to raise rates and defend the yen may be turning off the tap, even if Western central banks are slowly cutting rates to keep liquidity flowing.
The yen is rallying, as massive short positions against it are closed out, to drive the currency higher still and force yet more liquidation by the shorts, to create a circle every bit as vicious as it had previously been virtuous.
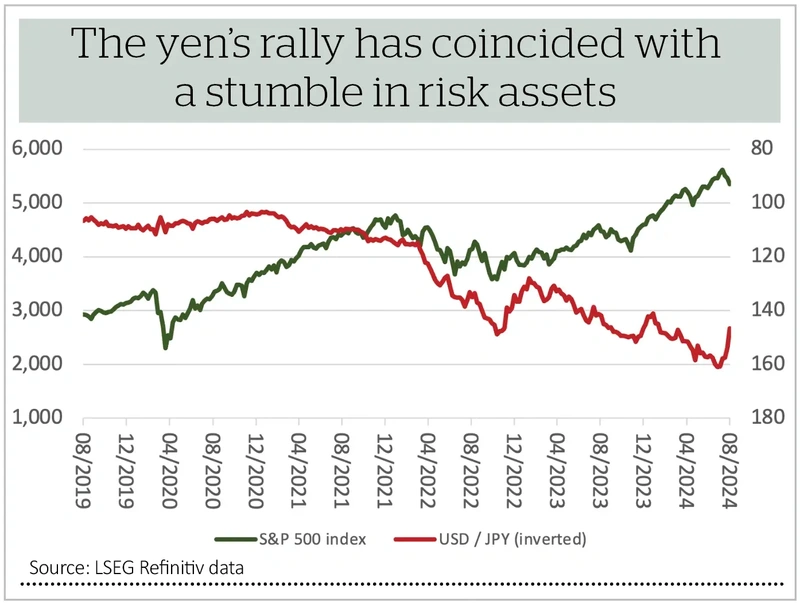
Finally, US equities in particular have gone up in a straight line and done so much faster than GDP growth, corporate earnings or cash flows. The result is that US equities look expensive: according to FactSet, the S&P 500 trades on 20.6 times forward earnings against a 10-year average of 17.9. As a result, the US S&P 500’s market’s capitalisation represents 160% of GDP, an all-time high. According to Professor Robert Shiller, the US stock market trades on a cyclically adjusted P/E (price-to-earnings) ratio of 35, a figure only exceeded in 2000 (and that did not end well).
LEAD INDICATORS
As the old saying goes, valuation never tells you when there may be trouble (or an opportunity) but it will tell you how far things can go (up or down) before something snaps back the other way.
Those numbers suggest either prices must fall (some way), or earnings must surge quickly for stock markets to regain their equilibrium – although UK equity prices are nowhere near as stretched as they are in the USA.
To test market sentiment, rather than fundamentals, investors can watch three indicators:
The first is the VIX index, or so-called fear index, which measures expectations of US stock market volatility in the month ahead. The long-run average reading since 1994 is 19. It is usually a good counter-cyclical indicator.
Sustained periods of low readings, down towards 12 or lower, speak of investor complacency and likely trouble ahead (because it won’t take much to frighten everyone).
A sustained run above say 30 suggests there is panic around and there may be bargains appearing, but the shake-out in this case could be violent. (This simply distils Buffett’s maxim about being fearful when others are greedy and greedy when others are fearful).
The second is again the yen, given its pivotal role in global market liquidity. If the Bank of Japan backtracks on its promise of more rate hikes that might help, although whether that stokes global inflation expectations is another challenge, and rapid cuts from the Fed and other central banks might stoke money supply and liquidity in the West, but they might fuel inflation fears too – which may be why gold is holding firm.
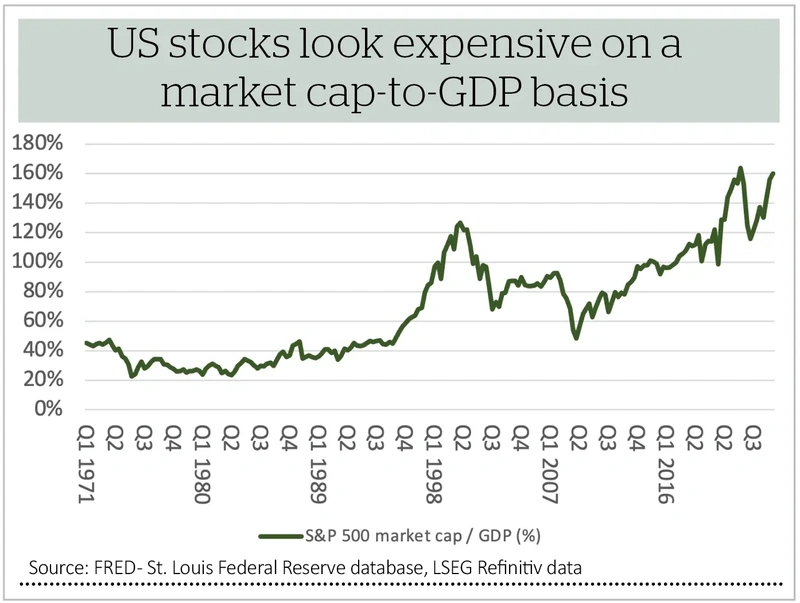
For those looking for an indicator that looks at both US markets and the US economy (and we are focusing on those are they are the biggest in the world on both counts) then nothing is usually more helpful than this column’s old friend, the Dow Jones Transportation index.
It has lagged the Dow Jones Industrials and lost momentum. That is usually a bad sign as it speaks of economic weakness. That indicator needs to start trucking again, or a summer squall could turn more serious.

Important information:
These articles are provided by Shares magazine which is published by AJ Bell Media, a part of AJ Bell. Shares is not written by AJ Bell.
Shares is provided for your general information and use and is not a personal recommendation to invest. It is not intended to be relied upon by you in making or not making any investment decisions. The investments referred to in these articles will not be suitable for all investors. If in doubt please seek appropriate independent financial advice.
Investors acting on the information in these articles do so at their own risk and AJ Bell Media and its staff do not accept liability for losses suffered by investors as a result of their investment decisions.