Archived article
Please note that tax, investment, pension and ISA rules can change and the information and any views contained in this article may now be inaccurate.

The world investment outlook is written by Russ Mould, AJ Bell Investment Director and contains a wealth of information on the world financial markets and events to help with your investment strategies in 2017.
Here he considers the outlook for the USA.
The identity of the new President is known and as they welcome Donald Trump’s tax cutting and infrastructure spending plans, stock markets can now get back to focussing on the other powerhouse in Washington: the US Federal Reserve, and whether further interest rate hikes from the central bank will check the equity and bond bull markets or not.
The three key issues for 2017
- President Trump and whether he can get support for his planned tax cuts and infrastructure spending (and whether they will then have the desired impact or not)
- The US Federal Reserve and how many interest rate hikes it pushes through
- The dollar and how far it can rise, as a galloping greenback could eventually crimp US corporate earnings and act as a global deflationary force
Politics
After a brutal, bruising campaign, Donald Trump will be sworn in as America’s forty-fifth President on 20 January after his defeat of Democratic Party candidate Hillary Clinton.
To complete its electoral triumph on 8 November, the Republican Party also kept control of both the House of Representatives and the Senate.
The Republican Party controls the White House and Capitol Hill
| Republicans | Democrats | |
| Presidency (Electors) | 306 | 232 |
| House of Representatives (seats) | 241 | 194 |
| Senate (seats) * | 52 | 46 |
Source: BBC. *Pending run-off in Louisiana on 10 December 2016.
However, the Republicans failed to garner the 60 seats needed in the Senate for the super-majority that would have given the new President much more room for manoeuvre and scope to neuter any attempts to block his planned domestic legislation.
Some may view this as a good thing and they may not all be Democrats. Trump is not a Republican Party insider by any means and it will be interesting to see how his fractious relationship with House leader Paul Ryan develops, given the latter’s preference for fiscal prudence and budgetary balance. The President-Elect’s planned corporate tax cuts and mooted $1 trillion infrastructure spending programme do not fit well with such principles so it remains to be seen whether Trump can push through his policies or not.
As Trump pieces together his Cabinet and sets to work, the coming year will be a quiet one on the political front in the USA.
Two states, New Jersey and Virginia, will hold gubernatorial contests. New Jersey Governor Chris Christie – a failed candidate for the Republican Party’s Presidential nomination in 2016 – cannot run again, as he will complete his second term in office in 2017.
Economics
The US economic recovery is getting long in the tooth, as it is nearly eight years old, but real escape velocity remains elusive – if America was firing on all cylinders, Trump’s fiscal plan would not be needed and its central bank, the Federal Reserve, would be moving to hike interest rates much more quickly.
As it is, America’s economy has not grown at a 3% rate in a calendar year for a decade and the Government’s debt pile has begun to approach 100% of GDP. Once corporate and consumer debt, student loans and municipal borrowing are taken into account, the burden surges to somewhere near 400% of GDP. No wonder Trump is looking at bringing in debt restructuring and turnaround specialist Wilbur Ross as his Secretary of Commerce.
That said, the US Federal Reserve is still expected to keep raising interest rates in 2017, albeit at a very steady pace from what remain near record-low levels.
US unemployment is low at 4.9%, but this is a lagging indicator. More encouragingly, forward-looking indicators like the purchasing managers’ indices (PMIs), or corporate sentiment surveys, stand comfortably above 50 as the year draws to a close. These readings represent a healthy improvement one earlier in the year and suggest American corporations are relatively optimistic about their prospects in 2017.
US unemployment stands at eight-year lows

Source: www.bls.gov
Corporate sentiment surveys suggest companies are optimistic for 2017

Source: Institute for Supply Management, Thomson Reuters Datastream, Trading Economics
This is not to say investors (or the Fed) should be complacent. Auto sales and housing have both been big drivers of the post-Financial Crisis recovery and both look to have lost some momentum, hampered by rising consumer debts and also the spike in bond yields which followed Trump’s election, as the markets priced in higher interest rates from the Fed. Industrial production figures also fail to inspire.
Feeble trend in US industrial output remains a concern
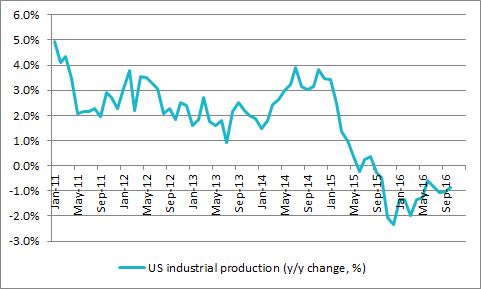
Source: FRED, St. Louis Federal Reserve database
That view on higher borrowing costs drove both mortgage rates and the dollar higher. A strong dollar would hobble US exports and corporate earnings, potentially short circuiting the post-Trump reflation rally which caught so many by surprise.
The buck, as benchmarked by a trade-weighted basket of currencies measured by The Bank of England is trending upward toward a 13-year high.
The dollar is rising in anticipation of an improved US economic performance
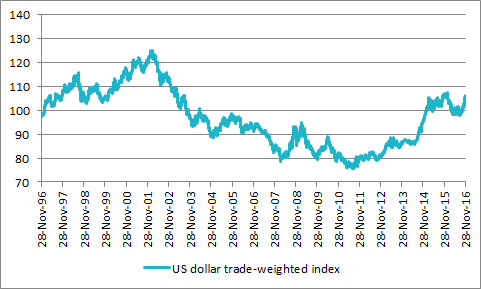
Source: Bank of England
Markets
If rising rates and a strong dollar do check America’s economic momentum, this would support economist Rudi Dornbusch’s quip that ‘“No post-war recovery has died in bed of old age—the Federal Reserve has murdered every one of them,” even if faith in the Trump economic plan remains undimmed for the moment.
If it succeeds, the economic and corporate earnings growth generated could help US stocks to sweep aside the impact of any Fed rate rises. A study of Fed rate cycles since 1971 shows that stocks have tended to do better when rates have been falling and not rising.
Historically US equities have done best when the Fed has been loosening rather than tightening policy
| US interest rate cycle | Duration of cycle (days) | Shift in rates | Average change in S&P 500 |
| Lower | 737 | -5.25% | 19.9% |
| Lower * | 1,005 | -5.25% | 28.8% |
| Higher | 742 | 5.39% | 10.3% |
Source: Thomson Reuters Datastream, US Federal Reserve
Based on all interest rate cycles since 1970 - eight lower, seven higher
* Assumes easing cycle ran beyond last rate cut and lasted until Fed stopped adding to QE, 29 October 2014
Analysts are certainly expecting a rebound in US earnings, fired by oil, healthcare, banks and technology in particular.
Analysts are looking for a big acceleration in US corporate earnings momentum in 2017

Source: Standard & Poor's research
They may need to be right to keep the US equity pot boiling, especially if bond yields go higher still. After a sharp increase (and therefore fall in prices) the US 10-year Treasury yield of 2.33% now compares favourably again with the yield available from the members of the S&P 500.
US 10-year Treasury yield spiked higher as 2016 drew to a close

Source: Thomson Reuters Datastream
US equities’ loss of their relative yield appeal compared to US Government bonds may dampen some enthusiasm for US stocks, especially as the Dow Jones Industrials, S&P 500, Russell 2000 and NASDAQ Composite indices all trade at all-time highs.
Warren Buffett’s preferred valuation methodology, market-cap-to-GDP, also suggests US stocks are pricey, although corporate profits also stand at a record high relative to GDP so this state of affairs can be justified, especially if companies’ earnings press higher as analysts expect in 2017, fired by Trump’s proposed reforms.
…. And market-cap-to-GDP metrics
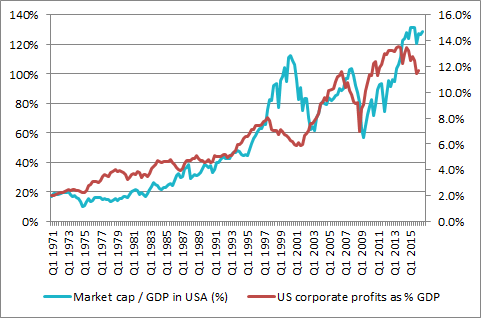
Source: Thomson Reuters Datastream, FRED, St. Louis Federal Reserve database.
Based on Wilshire 5000 index
The secret to US stocks in 2017, therefore, may lie with corporate earnings momentum. If analysts’ are right, and profits rally, then American stocks could forge further progress, especially as the Fed is likely to only take baby steps with interest rates.
But any sustained disappointment could leave stocks exposed on the downside, especially if faith in the Fed and the new President has any cause to wobble.
Top performing funds
Best performing US Large Cap Blend Equity OEICs over the last five years
| OEIC | Fund size £m | Annualised 5-yr performance | 12-month yield | OCF | Morningstar rating |
| Fidelity American Special Situations W (Acc) | 1,170.6 | 23.3% | 0.66% | 0.95% | ***** |
| Fidelity American Fund Y (Acc) USD | 7,230.8 | 22.1% | n/a | 1.13% | ***** |
| JP Morgan US Select I Net (Acc) | 209.1 | 21.4% | 0.74% | 0.60% | **** |
| JP Morgan America Equity C (Acc) | 970.7 | 21.3% | n/a | 0.85% | ***** |
| Neptune US Income C (Inc) GBP | 30.3 | 21.1% | 2.14% | 1.10% | **** |
Source: Morningstar, for US Large Cap Blend Equity category
Where more than one class of fund features only the best performer is listed.
Best performing North American Investment Trusts over the last five years
| Investment Trust | Market cap (£m) | Annualised 5-year performance | Dividend yield | Gearing | OCF* | Discount to NAV | Morningstar rating |
| JP Morgan US Smaller Companies | 135.3 | 24.4% | 0.0% | 7% | 1.69% | -8.3% | **** |
| North Atlantic Smaller Companies | 353.7 | 20.8% | n/a | 0% | 1.04% | -19.8% | **** |
| JP Morgan American | 967.8 | 19.1% | 1.1% | 9% | 0.69% | -3.2% | ***** |
| North American Income | 341.9 | 18.1% | 2.8% | 9% | 1.03% | -7.4% | **** |
| Jupiter US Smaller Companies | 178.3 | 15.8% | n/a | 0% | 1.03% | -12.5% | *** |
Source: Morningstar and the AIC, for North America and North American Smaller Companies Categories.
* Includes performance fee
Best performing US Large-Cap Blend Equity ETFs over the past five years
| ETF | Market cap (£m) | Annualised 5-year performance | Dividend yield | OCF | Morningstar rating | Replication method |
| Lyxor S&P 500 UCITS ETF D-USD | 1,713.8 | 20.4% | 1.98% | 0.15% | ***** | Synthetic |
| db x-trackers S&P 500 UCITS ETF 1C USD | 1,516.5 | 20.3% | n/a | 0.20% | ***** | Synthetic |
| PowerShares Dynamic US Market UCITS ETF GBP | 14.7 | 20.3% | n/a | 0.75% | **** | Physical |
| iShares Core S&P 500 UCITS ETF USD (Acc) | 14,688.1 | 20.3% | n/a | 0.07% | ***** | Physical |
| HSBC S&P 500 UCITS ETF | 1,737.7 | 20.2% | 1.75% | 0.09% | ***** | Physical |
Source: Morningstar, for US Large-Cap Blend Equity category.
Where more than one class of fund features only the best performer is listed.
Read more from our world investment outlook 2017 series:
World investment outlook 2017: UK
World investment outlook 2017: Europe

Written by:
Russ Mould
Investment Director
Russ Mould is AJ Bell's Investment Director. He has a Master's degree in Modern History from the University of Oxford and more than 30 years' experience of the capital markets.
Ways to help you invest your money
Put your money to work with our range of investment accounts. Choose from ISAs, pensions, and more.
Let us give you a hand choosing investments. From managed funds to favourite picks, we’re here to help.
Our investment experts share their knowledge on how to keep your money working hard.
Related content
- Fri, 13/06/2025 - 11:30
- Mon, 09/06/2025 - 10:43
- Fri, 06/06/2025 - 11:25
- Fri, 30/05/2025 - 13:55