Archived article
Please note that tax, investment, pension and ISA rules can change and the information and any views contained in this article may now be inaccurate.

As one year ends, clients and advisers often sit down to review portfolios and see what lessons can be drawn with regard to strategy for the future.
This year is ending with a flurry of renewed volatility, a collapse in the oil price, a renewed decline in bond yields and a wobble in stock markets – all developments few would have been forecasting 12 weeks ago, let alone 12 months.
The latest market action does look instructive. Events have yet again conspired to frustrate what were the consensus views of a year ago, namely bonds were a busted flush, the global economy would recover strongly and interest rates were set to rise sharply.
Intriguingly, the very same forecasts dominate the consensus for 2015 so perhaps all advisers and clients need to prepare for the unexpected once more. The need to build a properly balanced portfolio, designed to cover a range of eventualities, looks the best plan for the coming year and beyond.
The scope for heightened market volatility becomes all the greater as central bank policy potentially starts to show greater divergence around the world. Meanwhile someone, somewhere must be 'long and wrong' when it comes to oil and it would be no shock if the effects of crude's collapse were to go further than oil producers, both corporate and sovereign, and the firms who provide them with the necessary kit. Junk bond markets, lenders to explorers and speculators in the oil market could yet catch a nasty cold.
Oil's price plunge continues to concern the markets

Source: Thomson Reuters Datastream
Crude is the market's current obsession, as the market comes to share this column's fears that the price slide may reflect weak global growth as much as it does rampant supply (see Why the slide in Brent crude begs big questions 5 December 2014 here). The black stuff also touches on all three topics which look likely to dominate clients' attentions in 2015 - the dollar and debt and dividends.
- The US dollar is the world’s haven currency and its strength points to America’s economic outperformance of its Western peers, the prospect of global central banks running a wider range of policies next year and investors’ nagging doubts about the durability of the long-running stock and bond bull runs, doubts that are being magnified by oil price falls.
- The reach for yield and a sustainable source of income from dividends and coupons will remain a priority for many clients, even if oil's slide means there is no room for complacency when it comes to the FTSE 100's 4% prospective yield for 2015.
- Yield will remain important as Western governments’ huge sovereign debt, and emerging markets' substantial corporate liabilities, mean the UK and US are unlikely to raise interest rates substantially, if at all, in 2015. Returns on cash will remain subdued and bonds could surprise again, despite the long-term dangers posed by the combination of record low yields and loose central bank policy.
The name is bond
It is worth stepping back and looking at the big picture as 2014 draws to a close. Those who argued the equities would stumble once the Federal Reserve tapered its monthly quantitative easing (QE) programmes from $85 billion last Christmas to zero by October will be feeling at least partly vindicated. Following the fourth quarter's volatility, higher quality bonds are now outperforming again as risk assets – stocks, junk bonds and commodities – give up a big chunk of the gains achieved earlier in the year.
Bonds are outperforming as the year draws to a close
| Dividend payment (£ million) | Forecast dividend per share (p) | Forecast yield * | Forecast earnings dividend cover | ||
|---|---|---|---|---|---|
| Royal Dutch Shell | 7,727 | 118.8 | 2% | 6.0% | 1.67x |
| HBC | 6,660 | 34.7 | 7% | 5.7% | 1.74x |
| BP | 4,696 | 25.8 | 4% | 6.7% | 1.71x |
| GlaxoSmithKline | 3,942 | 81.1 | 1% | 5.9% | 1.14x |
| Vodafone | 3,054 | 11.5 | 2% | 5.4% | 0.56x |
| BAT | 2,889 | 155.0 | 7% | 4.6% | 1.45x |
| AstraZeneca | 2,244 | 177.7 | 1% | 3.9% | 1.44x |
| Lloyds | 2,070 | 1.9 | 174% | 3.8% | 2.83x |
| Rio Tinto | 2,036 | 144.0 | 8% | 4.1% | 1.89x |
| National Grid | 1,689 | 44.9 | 3% | 5.1% | 1.29x |
Thomson Reuters Datastream, AJ Bell Research. Covers period 1 January to 16 December 2014
Markets' loss of risk appetite as soon as Fed-provided liquidity disappeared is a concern, especially as Japan's super-charged QE scheme has failed to provide additional support. Six years after QE-I in America, the merits of this monetary experiment remain unproven, at least in terms of sustained economic growth, even as Japan increases its commitments and Europe considers taking the plunge. One US Federal Reserve official, Richard Fisher of the Dallas Fed, is even talking about the US central bank letting its bond holdings simply mature and run off, as a form of monetary tightening in response to better economic news. This potential policy divergence brings us to the first key theme for 2015, the dollar.
Big bucks
The greenback's gains in 2015 suggests the markets are pricing in tighter monetary policy in America or that investors’ appetite for risk is falling, or both. In the latter instance the dollar’s haven status will serve it well and a persistent increase in the coming year could have huge implications.
The dollar advanced strongly in 2014
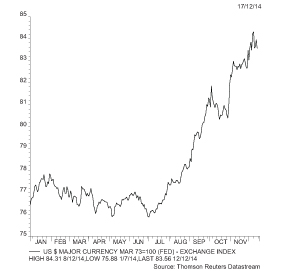
Source: Thomson Reuters Datastream
The dollar bull runs of the 1980s coincided with financial carnage in Latin America and the advance of the 1990s with chaos in Asia. On each occasion, emerging market sovereigns and companies found themselves struggling to service their dollar-denominated debts.
History may have begun to repeat itself in 2014. The following two tables highlight the performance of key equity markets by geography in the year to date.
Emerging markets have underperformed in 2014
| 2014 performance | |
|---|---|
| MSCI Frontier Markets | 1.2% |
| MSCI G7 | 0.8% |
| MSCI World | 0.3% |
| MSCI Emerging Markets | -9.2% |
Source: Thomson Reuters Datastream, AJ Bell Research. Covers period 1 January to 16 December 2014
… as Japan and America led the way
| 2014 performance | |
|---|---|
| Japan - Nikkei 225 | 3.2% |
| USA - Dow Jones | 3.0% |
| Europe - STOXX 600 | 0.2% |
| Asia ex-Japan - MSCI | -3.4% |
| UK - FTSE 100 | -6.2% |
| Latin America - MSCI | -22.0% |
| Eastern Europe - MSCI | -45.0% |
Source: Thomson Reuters Datastream, AJ Bell Research. Covers period 1 January to 16 December 2014
Emerging market countries’ finances are in better shape than 20 or 30 years ago but companies have borrowed heavily, as evidenced by booming issuance of corporate debt . If emerging markets temporarily lose some of their growth lustre, this could further boost demand for dollars. Investors may decide they can get exposure to decent economic growth and benefit from a rising currency by buying US assets in preference to higher-risk emerging market stocks or bonds, even if it is getting harder to make a valuation case for American equities in particular.
Borrowed time
When all is said and done, 2014 has not done much to boost any clients' wealth, unless they had a portfolio chock-full of bonds, a portfolio choice which the consensus was keen to rubbish a year ago.
Sovereign debt did well again in 2014 as junk lost favour late on
| 2014 performance | |
|---|---|
| Germany 10-year Bunds | 14.4% |
| UK 10-year Gilts | 12.8% |
| UK Corporate Bonds | 12.2% |
| US 10-year Treasuries | 9.0% |
| UK High Yield Bonds | 6.3% |
| US AAA-rated Corporate Bonds | 5.3% |
| Japan 10-year JGBs | 4.5% |
| Emerging Market Corporate Bonds | -3.0% |
| US High Yield Bonds | -6.9% |
| Emerging Market Sovereign | -7.7% |
Source: Thomson Reuters Datastream, AJ Bell Research. Covers period 1 January to 16 December 2014
It does seem counter-intuitive that bonds should do so well when supply has never been higher. According to Tim Price of PFP Group in his weekly blog The Price of Everything [END], total debt securities came to $90.8 trillion at the end of 2013, up from $69.2 trillion in 2007 when the debt crisis first hit home.
This looks to defies the laws of supply and demand but QE schemes and central bank bond buying have helped to drive yields lower, while clients' need for a reliable income remains undiminished. Demographic trends such as increased human longevity could keep bond yields lower for longer than many think, at least unless inflation suddenly rips out of central banks' control.
Governments want to try and stoke mild inflation and keep interest rates low to help them fund and erase their monstrous debts – despite their efforts to cut spending and boost growth, the sixteenth Geneva Report on the World Economy reveals the global debt-to-GDP ratio has increased since the 2007 crisis from 176% to 214%, excluding financial companies’ borrowings.
Inflation, if and when it comes, will erode the value of these liabilities in ‘real terms.’ But Japan’s feeble growth path since the bursting of its debt-fuelled property and stock market bubble in 1989 shows what could happen if it does not. Central banks will therefore continue to fight what Christine Lagarde of the International Monetary Fund has called “the ogre of deflation.”
Falling prices would increase the value of government debts and make the interest and final repayments more expensive. This in turn explains Japan’s decision to crank up its Quantitative Easing scheme and Europe’s gradual moves toward such a plan. Both are struggling to grow under the burden of their huge debts and monetary policy here could diverge from that of the US and UK, who are expected to increase rates and tighten rather than loosen in 2015.
Whether they do or not is a different matter, especially as inflation continues to sink and deflation remains the fear. These concerns are underwritten by 2014's action in the commodity markets, where oil, iron ore and natural gas have all taken a caning. Only aluminium and nickel eked out price gains, thanks to specific supply-side issues.
Commodity price falls are fuelling fears of deflation
| 2014 performance | |
|---|---|
| Nickel | 15.3% |
| Aluminium | 6.9% |
| Gold | -1.0% |
| Wheat | -2.0% |
| Copper | -13.1% |
| Natural gas (Henry Hub) | -18.0% |
| Silver | -19.5% |
| Corn | -23.7% |
| Oil (Brent crude) | -45.6% |
| Iron ore | -50.0% |
Source: Thomson Reuters Datastream, AJ Bell Research. Covers period 1 January to 16 December 2014
Cash in hand
If interest rates stay lower for longer and bond yields remain depressed, this could increase the attraction to clients of those assets which provide a safe and reliable income, notably quality bonds and high-yielding equities.
Aggregating the consensus dividend forecasts for each of the FTSE 100's constituent companies suggest the index offers a yield of some 4% at around the 6,200 mark.
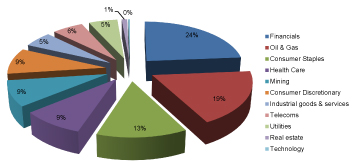
This looks tempting and could help put a floor under the market but great care is needed here. By sector, analysts expect Oil and Gas stocks to make 19% of those distributions and Miners a further 9%, with Financials the biggest contributor at 24% - so more than half of the FTSE 100's forecast £71.9 billion in dividend payments are due to come from relatively unpredictable sources.
Oils, Miners and Financials are expected to make 52% of the FTSE 100's dividend payments in 2015...
Source: Digital Look, consensus analysts estimates, AJ Bell Research
...and generate 59% of the index's aggregate pre-tax profit

Source: Digital Look, consensus analysts estimates, AJ Bell Research
Clients must study these areas to check earnings and free cash flow cover for dividend payments are robust and the dividend payment forecasts reliable – or at least get a good income fund manager to do the donkey work for them.
Just 10 stocks are expected to generate half of the FTSE 100's predicted £71.9 billion dividend payments for 2015
| Dividend payment (£ million) | Forecast dividend per share (p) | 2015 Forecast dividend growth | Forecast yield * | Forecast earnings dividend cover | |
|---|---|---|---|---|---|
| Royal Dutch Shell | 7,727 | 118.8 | 2% | 6.0% | 1.67 x |
| HBSC | 6,660 | 34.7 | 7% | 5.7% | 1.74 x |
| BP | 4,696 | 25.8 | 4% | 6.7% | 1.71 x |
| GlaxoSmithKline | 3,942 | 81.1 | 1% | 5.9% | 1.14 x |
| Vodafone | 3,054 | 11.5 | 2% | 5.4% | 0.56 x |
| BAT | 2,889 | 155.0 | 7% | 4.6% | 1.45 x |
| AstraZeneca | 2,244 | 177.7 | 1% | 3.9% | 1.44 x |
| Lloyds | 2,070 | 2.9 | 174% | 3.8% | 2.83 x |
| Rio Tinto | 2,036 | 144.0 | 8% | 4.1% | 1.89 x |
| National Grid | 1,689 | 44.9 | 3% | 5.1% | 1.29 x |
Source: Digital Look, consensus analysts estimates, AJ Bell Research
These are not AJ Bell's forecasts, just an aggregation of the current analysts' consensus for each FTSE 100 stock. As such, they should be treated with caution, given analysts' propensity to be optimistic and the relatively low dividend cover on offer – just one of the ten expected biggest payers offers cover of more than two times, based on 2015 earnings per share forecasts.
Goodwill to all
This column will now take a festive break, returning on 9 January 2015. May I offer a big thank you to all regular readers for your support and everyone at AJ Bell hopes you have a Happy Christmas and prosperous New Year.
Russ Mould, AJ Bell Investment Director.

Written by:
Russ Mould
Investment Director
Russ Mould is AJ Bell's Investment Director. He has a Master's degree in Modern History from the University of Oxford and more than 30 years' experience of the capital markets.
Ways to help you invest your money
Put your money to work with our range of investment accounts. Choose from ISAs, pensions, and more.
Let us give you a hand choosing investments. From managed funds to favourite picks, we’re here to help.
Our investment experts share their knowledge on how to keep your money working hard.
Related content
- Fri, 13/06/2025 - 11:30
- Mon, 09/06/2025 - 10:43
- Fri, 06/06/2025 - 11:25
- Fri, 30/05/2025 - 13:55