Archived article
Please note that tax, investment, pension and ISA rules can change and the information and any views contained in this article may now be inaccurate.

Markets remain fixated by the European Central Bank's (ECB) decision to launch a Quantitative Easing (QE) programme last Thursday (22 January) and the results of the Greek general election (25 January). The events look interconnected anyway, as the timing of the ECB's policy shift leaves it with scope to keep markets sweet by using any bond purchases to dampen any volatility in the continent's government debt markets.
For the moment, markets seem to be following ECB President Mario Draghi's preferred script, as government bond yields decline yet further. This may suit his agenda nicely but such a trend leaves investors with a diminishing range of options when it comes to the sovereign fixed-income portion of their portfolio. This can only serve to place an ever-greater emphasis upon assets which can generate an income. As Western government bond yields grind lower this may well serve to stimulate fresh interest in emerging market government bonds, corporate bonds and also equities which offer a decent yield.
The longer government bond yields and interest rates on cash remain at or near record lows, the greater the craving for yield may become. Under these circumstances equity income funds could remain a popular choice and the tables below illustrate, advisers and investors have a wide range of dedicated collectives from which to choose in just the open-ended investment company (OEIC) arena. Investment trusts and Exchange-Traded Funds provide additional options.
Best performing UK equity income funds over the last five years
| OEIC | ISIN | Fund size £ million |
Annualised five- year performance | Dividend yield | Ongoing charge | Morningstar rating |
| Unicorn UK Income B Inc | GB00B00Z1R87 | 579.2 | 19.6% | 5.7% | 0.81% | ***** |
| PFS Chelverton UK Equity Income B Inc | GB00B1FD6467 | 352.8 | 19.2% | 5.4% | 1.00% | ***** |
| Fidelity UK Income Opportunities R Inc | GB00BHBFDT25 | 9.1 | 17.8% | 4.0% | 1.10% | n/a |
| Threadneedle UK Equity Aplha Income Net Instl GBP Inc | GB00B12WJV48 | 859.0 | 15.7% | 4.7% | 1.62% | ***** |
| Henderson Global Care UK Income I Inc | GB0005030373 | 133.1 | 15.5% | 4.0% | 0.86% | **** |
Source: Morningstar, AJ Bell Research Centre. Covers the UK Equity Income category.
Clean funds only. Where more than one class of fund features only the best performer is listed.
Best performing European equity income funds over the last five years
| OEIC | ISIN | Fund size £ million |
Annualised five- year performance | Dividend yield | Ongoing charge | Morningstar rating |
| Threadneedle Pan European Equity Dividend Instl GBP | GB00B132M811 | 45.6 | 12.4% | 4.3% | 1.19% | ***** |
| JP Morgan European Strategic Dividend | LU0289478959 | 2,035.7 | 9.1% | 2.4% | 1.92% | **** |
| Schroder European Equity Yield A GBP | LU0242609765 | 166.8 | 8.1% | 9.5% | 1.99% | **** |
| Argonaut Pan European Dividend Income GBP I Inc | IE00B0S5Q317 | 5.9 | 7.9% | 6.9% | 1.49% | *** |
| M&G Pan European Dividend Fund I Acc | GB00B74YXH41 | 55.4 | 7.3% | 4.1% | 1.02% | **** |
Source: Morningstar, AJ Bell Research Centre. Covers the Europe Equity Income category.
Clean funds only. Where more than one class of fund features only the best performer is listed.
Best performing Global equity income funds over the last five years
| OEIC | ISIN | Fund size £ million |
Annualised five- year performance | Dividend yield | Ongoing charge | Morningstar rating |
| Threadneedle Global Equity Income Inst. GBP Inc | GB00B1Z2MX45 | 1,367.0 | 12.2% | 4.5% | 1.08% | **** |
| M&G Global Dividend EUR C | GB00B39R2T55 | 9,109.4 | 12.1% | 3.4% | 0.91% | ***** |
| Newton Global Higher Income Inst Acc | GB00B0MY6X46 | 4,392.2 | 12.1% | 4.2% | 1.05% | ***** |
| Standard Life Investments Global Equity Income Retail Founder Acc | GB0004330600 | 116.7 | 11.7% | 2.3% | 1.07% | **** |
| Sarasin Global Higher Dividend I GBP Acc | GB00B13GWK50 | 454.2 | 11.5% | 3.4% | 1.74% | *** |
Source: Morningstar, AJ Bell Research Centre. Covers the Global Equity Income category. Clean funds only. Where more than one class of fund features only the best performer is listed.
Gilt complex
Investors might find it hard to get excited about a 1.5% yield on the ten-year UK Government bond, or Gilt, but with inflation of 0.5% in December (at least according to the official numbers) that still provides a real return. Moreover, as Canaccord Genuity's Mark Glowrey points out in his ever-helpful daily email, this 1.5% yield also handsomely outstrips the 0.27% available on 10-year Japanese Government Bonds (JGBs) or the 0.39% offered by 10-year German bunds, let alone the Swiss equivalent, where the yield is minus 0.17%. As Glowrey put its: “Gilts are a high-yield member of the Government bond asset class.”
UK 10-year Gilts still offer a premium yield

Source: Thomson Reuters Datastream
Germany is not far behind Switzerland, with negative yields all the way out through to the seven-year government paper. Investors' willingness to hold these instruments and pay for the chance to do so may tell you what they think of the alternatives. It may be hard to find many who find French 10-year OATS at 0.57% or Spanish 10-year government bonds at 1.38% to be propositions where the rewards sufficiently compensate for the risks, given the respective nations' notorious inability to balance their books.
That said, the ECB's QE programme establishes the monetary authority as a willing buyer of this paper, seemingly regardless of price. Investors could therefore see supply of European sovereign paper diminish at a time when their need for predictable income streams for their retirement remains as acute as ever.
This may force money to look for fresh sources of income and such financial repression is in fact one of the key goals of QE – drive money into other assets to squeeze bond yields down (and hopefully demand for credit up) while creating a wealth effect through rising asset prices and stock markets. Suffice to say the jury is still out on whether the gains truly pass through to the end economy, though for the moment bond and stock prices are tradinf at or near record highs in many cases.
The right balance
QE could actually backfire in that savers may refuse to take more risk, in the view the potential rewards may be inadequate, and instead cut their spending and choose to hoard cash.
There is certainly no point buying a bond in an overseas currency if that counter then collapses against sterling. Buying a corporate bond only for the debtor to renege on a coupon payment or go bust owing to financial difficulties would hardly help portfolios either.
The search for income does therefore require a delicate balancing act between risk and reward. Jan Dehn, Head of Research at fund management giant Ashmore, continues to champion the cause of emerging market debt. Citing the Swiss National Bank's decision to cut its headline interest rate to minus 0.75% he asserts in a written comment: “Investors will now be effectively charged 75 basis points for the pleasure of investing in Switzerland. Alternatively, investors can put their money into a broad portfolio of dollar-denominated external sovereign bonds issues by more than 60 less indebted, faster-growing, non-money-printing Emerging Market countries and get paid 5.7%.”
The risk posed by emerging markets is not so much one of default, barring basket cases such as Venezuela, although Russia remains an area of concern if rating agency Standard & Poor's' downgrade of Moscow's debt to the 'junk' grade of BBB- just this week (26 January) is a guide. The dangers are posed by currency depreciation and liquidity (or its potential absence in the event of increased risk aversion and everyone heading for the exit at once). Investors need to measure these risks against the potential benefit of that chunky-looking yield to which Dehn refers when they consider emerging market debt as a portfolio option.
Best performing Emerging Market Bond funds over the last five years
| OEIC | ISIN | Fund size £ million |
Annualised five- year performance | Dividend yield | Ongoing charge | Morningstar rating |
| Goldman Sachs SICAV Growth & Emerging | LU0129914015 | 3,577.5 | 8.5% | 4.5% | 0.94% | ***** |
| HSBC Global Emerging Markets | LU0164943648 | 2,496.0 | 7.9% | n/a | 1.35% | **** |
| MFS Meridian Emerging Markets Debt | LU0219434957 | 2,373.7 | 7.7% | n/a | 0.88% | **** |
| Capital Group Emerging Markets Debt (Lux) C | LU0292263935 | 435.8 | 7.1% | n/a | 0.15% | *** |
| M&G Emerging Markets Bond £ I Net | GB00B4TL2D89 | 98.4 | 7.0% | 3.7% | 0.94% | **** |
Source: Morningstar, AJ Bell Research Centre. Covers the Emerging Market Bond category. Clean funds only. Where more than one class of fund features only the best performer is listed.
Corporate solution
Corporate bonds and equities are other logical avenues for yield-starved portfolio-builders to explore.
The London Stock Exchange is doing its bit to provide corporate bonds as an alternative through the Order Book for Retail Bonds (ORB), whose model is the fabulously successful MOT, Milan's Electronics Government Bond and Securities Market. ORB celebrates its fifth birthday in February and firms have raised over £4 billion on the platform since inception, but new issuance has dried up and the secondary market remains thin, as clients prefer to buy the bonds at issue and then hold them to maturity.
Bonds where trading is more active include the 5.5% EnQuest 2022 and Premier Oil 5.0% 2020 notes. The relatively fat yields on offer reflect the operational and financial risks associated with the corporate issuer, a fact brought into relief by the oil price collapse and subsequent volatility in the bond prices.
The price of oil firms' bonds on ORB has been very volatile
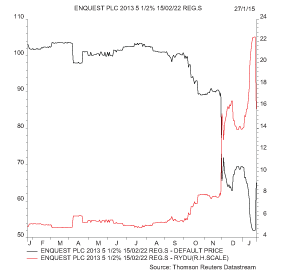
Source: Thomson Reuters Datastream

Source: Thomson Reuters Datastream
Anyone buying these instruments now will enjoy yields-to-maturity which are higher than the actual coupon, as they would be getting in below the par price of 100 and thus booking a capital gain in the bargain (assuming the bonds are redeemed at par, all coupons are paid and the issuers suffer no financial mishap in the next five and seven years respectively).
This may appeal to some investors and not to others, who may decide they would prefer the calmer waters of the 3.2% and 2.8% yields offered by stalwart FTSE 100 stocks such as Unilever and Diageo respectively, according to consensus analyst forecasts.
Stock market sweep
Investors' preferences will come down to their target returns, risk tolerance and ultimate investment strategy. At least the UK is blessed in this area. Based on current consensus estimates the FTSE 100 offers a yield of around 3.5%, way better than Gilts or cash and with the scope for capital gains on top, should share prices rise. Equally, there is the chance share prices fall and the dividends are cut or even passed altogether, a calamitous chain of events evidenced by fallen giant Tesco in 2014. In this case, yield hunters came badly unstuck.
When analysing individual stocks as possible income picks it is vitally important to study a company's balance sheet and cashflow, not just over a year or two but a 10-year cycle, to see how profits and cash swing about during the good times and bad. This can reveal whether a dividend could be put at risk in the future even it it looks safe now. As a rule of thumb, profits per share should cover dividends per share by an average of at least two times, ideally over a whole cycle, although strongly cash-generative areas such as utilities and tobacco can get away with less.
If this detective work is all a bit too much, then funds can take the strain here, as shown by the tables near the top. Professional money managers, in return for a fee, will do the donkey work for you. Equally, there are many investment trusts dedicated to providing a good income stream and the tables below show the best performers on a five-year view from the Global Equity Income and UK Equity Income categories.
Best performing Global equity income investment companies over the last five years
| Investment company | EPIC | Market cap (£ million) |
Annualised five- year performance * | Dividend Yield | Ongoing charges ** | Discount to NAV | Gearing | Morningstar rating |
| London & St. Lawrance | LSLI | 110.3 | 14.3% | 3.7% | 0.89% | 0.8% | 0% | ***** |
| Securities Trust of Scotland | STS | 172.4 | 13.2% | 3.4% | 0.89% | -6.8% | 7% | **** |
| F&C Managed Portfolio Income | FMPI | 35.5 | 12.8% | 4.0% | 1.16% | 1.4% | 3% | ***** |
| Invesco Perpetual Select - Global Equity | IVPG | 49.1 | 11.4% | 2.3% | 1.06% | -2.6% | 14% | **** |
| Murray International B | MYIB | 1,347.5 | 11.1% | 4.1% | 1.08% | 4.1% | 13% | n/a |
Source: Morningstar, The Association of Investment Companies, AJ Bell Research Centre. Covers the Global Equity Income category.
* Share price.
** Includes performance fee
Best performing Global equity income investment companies over the last five years
| Investment company | EPIC | Market cap (£ million) |
Annualised five- year performance * | DividendYield | Ongoing charges ** | Discount to NAV | Gearing | Morningstar rating |
| Investment Company | INV | 19.7 | 22.3% | 5.3% | 2.54% | 4.6% | 0% | n/a |
| Finsbury Growth & Income | FGT | 593.8 | 22.2% | 2.0% | 0.82% | -0.4% | 4% | ***** |
| Lowland | LWI | 342.6 | 19.7% | 2.8% | 0.88% | -6.6% | 14% | **** |
| Perpetual Income and Growth | PLI | 950.1 | 18.0% | 3.0% | 1.85% | -1.8% | 16% | ***** |
| Edinburgh | EDIN | 1,298.5 | 17.3% | 3.5% | 1.10% | -2.4% | 13% | ***** |
Source: Morningstar, The Association of Investment Companies, AJ Bell Research Centre. Covers the Global Equity Income category.
* Share price.
** Includes performance fee
Monthly plan
Some investors may also like to note an excellent piece of research from the Association of Investment Companies (AIC) on the frequency of dividend payments from its members.
Four members of the AIC will pay monthly dividends in 2015
| Investment company | EPIC | Market cap (£ million) |
Annualised five- year performance * | Dividend Yield | Ongoing charges ** | Discount to NAV | Gearing | Morningstar rating |
| F&C Commercial Property | FCPT | 1,167.1 | 16.5% | 4.2% | 1.74% | 22.1% | 24% | n/a |
| Fair Oaks Income | FAIR | 131.5 | n/a | 8.3% | n/a | 5.7% | 0% | n/a |
| TwentyFour Select Monthly Income | SMIF | 120.2 | n/a | 6.2% | n/a | 2.9% | 0% | n/a |
| Forest Company | FCO | 9.1 | n/a | 2.8% | 4.12% | n/a | 0% | n/a |
Source: Morningstar, The Association of Investment Companies, AJ Bell Research Centre.
* Share price.
** Includes performance fee
One-third of investment companies now pay quarterly dividends, up from 17% five years ago, says the AIC, which adds four vehicles now pay dividends on a monthly basis – F&C Commercial Property, Forest Company, TwentyFour Select Monthly Income and Fair Oaks Income. Certain investors may find this helpful when it comes to matching cash needs with their liabilities though in each instance it will remain vitally important to ensure the underlying portfolios fit with their strategy, target returns and appetite for risk.
As its name suggests, F&C Commercial Property invests direct in British real estate, while Forest Company hails from the specialist area of investing in forests and timber. Fair Oaks Income and TwentyFour Select come from the specialist debt investment sector.
Russ Mould, AJ Bell Investment Director

Written by:
Russ Mould
Investment Director
Russ Mould is AJ Bell's Investment Director. He has a Master's degree in Modern History from the University of Oxford and more than 30 years' experience of the capital markets.
Ways to help you invest your money
Put your money to work with our range of investment accounts. Choose from ISAs, pensions, and more.
Let us give you a hand choosing investments. From managed funds to favourite picks, we’re here to help.
Our investment experts share their knowledge on how to keep your money working hard.