Archived article
Please note that tax, investment, pension and ISA rules can change and the information and any views contained in this article may now be inaccurate.

Financial markets seem to be looking back fondly upon Donald J. Trump's first four-year term in the White House and hoping for more of the same. Trump's victory in the 2016 election was initially greeted with trepidation, and the US government bond market feels less enthusiastic this time around. On the flip side equities, the dollar and Bitcoin seem pleased by November 2024’s election result. So investors may need to look more closely at what happened between 2017 and 2021, especially as US share prices and equity valuations, are much higher now than they were eight years ago.
Stock markets
Even though stock market investors were unsure of what to make of Trump when he first took power in 2017, as they fretted over his plans for tariffs in particular, the headline equity indices ultimately did well during his first term in the White House.
The Dow Jones Industrials rose by 56%, the S&P 500 by 67% and the Nasdaq more than doubled. Such numbers generally put other options including emerging markets, Europe and the UK in the shade.
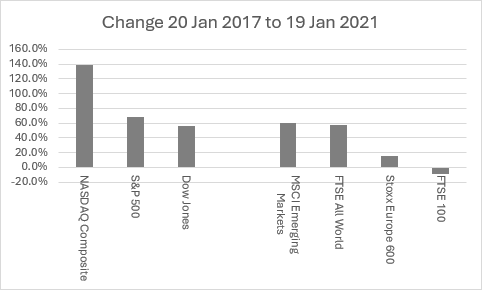
Source: LSEG Refinitiv data. Capital returns in local currency.
Within the Dow Jones, technology led the way, as perhaps could be expected given how the broader Nasdaq performed and also the rise (and rise) of the Magnificent Seven of Alphabet, Amazon, Apple, Meta, Microsoft, Nvidia and Tesla – although at the time, attention was focused more upon the FAANG quintet (Facebook, as it was then, Amazon, Apple, Netflix and Google, as it was then).
| Dow Jones Industrials | ||
|---|---|---|
| Company | Sector | Change 2017-2021 |
| Top 5 | ||
| Apple | Leisure Goods | 326.0% |
| Amazon | Retailers | 286.0% |
| Microsoft | Software & Computer Services | 245.0% |
| Salesforce | Software & Computer Services | 185.0% |
| Nike | Personal Goods | 162.0% |
| Bottom 5 | ||
| Coca-Cola | Beverages | 17.4% |
| Verizon | Telecommunications | 8.2% |
| 3M | General Industrials | (5.2%) |
| Chevron | Oil, Gas & Coal | (18.2%) |
| IBM | Software & Computer Services | (24.4%) |
Source: LSEG Refinitiv data. Capital returns from 20 January 2017 to 19 January 2021. Based upon current members of the Dow Jones Industrials index. In 2017 DowDuPont replaced DuPont. In 2018 Walgreens Boots Alliance replaced General Electric. In 2019 Raytheon (now RTX) replaced United Technologies. In 2020, Amgen, Honeywell and Salesforce replaced ExxonMobil, Pfizer and Raytheon. In 2024, Amazon, Nvidia and Sherwin-Williams replaced Walgreens Boots Alliance, Intel and Dow Inc.
One big laggard was oil major Chevron, while its industry peer and rival ExxonMobil was actually kicked out of the Dow Jones in 2020. Given Trump’s focus on energy policy, desire for cheap sources of fuel to help manage inflation and antipathy to renewables, it will be interesting to see if oil and gas stocks fare any better this time around, especially as the S&P 500 showed the same trend of technology up, hydrocarbon producers down even more starkly during 2017-2021.
| S&P 500 | ||
|---|---|---|
| Company | Sector | Change 2017-2021 |
| Top 10 | ||
| Enphase Energy | Electricity | 10,800% |
| Tesla | Autos & Parts | 1,630% |
| AMD | Technology Hardware | 817% |
| Caesars Entertainment | Travel & Leisure | 801% |
| Match Group | Software & Computer Services | 709% |
| Paycom Software | Software & Computer Services | 708% |
| Generac Holdings | Industrial Engineering | 592% |
| Insulet | Medical Equipment | 576% |
| Axon Enterprise | Aerospace & Defence | 541% |
| ServiceNow | Software & Computer Services | 523% |
| Bottom 10 | ||
| Devon Energy | Oil, Gas & Coal | (56.7%) |
| Carnival | Travel & Leisure | (60.9%) |
| GE Aerospace | Aerospace & Defence | (62.6%) |
| Halliburton | Oil, Gas & Coal | (63.6%) |
| Kraft Heinz | Food Producers | (63.6%) |
| Occidental Petroleum | Oil, Gas & Coal | (66.4%) |
| Schlumberger | Oil, Gas & Coal | (70.6%) |
| APA | Oil, Gas & Coal | (71.2%) |
| EQT | Oil, Gas & Coal | (72.9%) |
| PG&E | Electricity | (80.4%) |
Source: LSEG Refinitiv data. Capital returns from 20 January 2017 to 19 January 2021. Based on current crop of S&P 500 constituents. 40 current members of the index joined after 19 January 2021.
Ultimately, Trump’s first term was an above-average one so far as US equities are concerned, using the Dow Jones Industrials index as a benchmark. However, it’s noticeable that the market lost momentum after a very fast start in the first year, even if the fourth and final year was not helped by the arrival of Covid-19.
Moreover, US stocks have done very well since Trump’s first inauguration ceremony eight years ago, and expectations are higher too. This could be a tricky combination if there is any nasty surprise lurking in the next four years. The S&P has only managed back-to-back advances of more than 20% on four prior occasions since 1900 and 2023-24 was the fifth.
The good news for bulls is that consecutive gains of a fifth or more in each of 1995 and 1996 were followed by three more belting years in 1997, 1998 and 1999 as the mania for technology, media and telecoms (TMT) stocks hit top gear. The smash only came in 2000 and the subsequent bear market then lasted three years, as a big chunk of the gains made on the way up was then erased.
Less encouragingly, the surge of 1927 and 1928 took investors face first into 1929’s Wall Street Crash and four straight down years. The rally of 1935 and 1936 was followed by a brutal down year in 1937. And the two years of 20%-plus gains in 1954 and 1955 were followed by a flaccid 1956 and a torpid 1957.
As such, it might not be entirely wise to assume that 2025 is certain add to the current storming bull run, especially as various valuation metrics look lofty by historic standards. Even using the Shiller CAPE ratio, which Professor Shiller clearly asserts is not a tool for timing the market, the US equity market has rerated to 37 times earnings from nearly 28 times when Trump first took power in January 2017.
The dollar
The dollar, as benchmarked by the trade-weighted DXY (‘Dixie’) currency basket, sits at its highest mark since November 2022 after a strong run in the wake of Trump’s election victory.
One theory is that Trump’s policies could stoke economic strength, even inflation, and thus necessitate tighter monetary policy from the US Federal Reserve, with the result that higher returns on cash draw money into the greenback. Another theory is that higher borrowing will oblige the US to offer higher interest rates to tempt investors to buy Treasuries. And another is that tariffs will work to reduce America’s trade deficit and thus reduce the flow of dollars out of the country used to pay for foreign goods.
Either way, currency trades are backing the buck. But an initial surge in the dollar during Trump’s first presidency fizzled quickly, as he began to badger the US Federal Reserve for interest rate cuts, especially as economic growth stumbled during the middle years.
Whether he will get back on Fed chair Jay Powell’s case this time around remains to be seen, but Mr Powell’s statement back in December that “we are in a new phase” could mean the US central bank is not planning on radical rate cuts in 2025. Indeed, markets are pricing in one, maybe two, one-quarter point rate cuts at the most, a view that is a further source of support for the dollar. If Trump decides this is not enough, it will be interesting to see if the greenback goes lower once more.
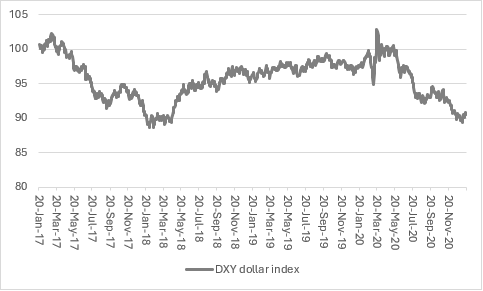
Source: LSEG Refinitiv data
US Treasury yields
The US Federal Reserve took the headline Fed Funds rate from 0.75% in January 2017 to 2.5% by December 2018, only to quickly reverse course when Covid-19 struck in 2020 taking the key US interest rate back down to 0.25% by the time Trump left office. The central bank also turned on the monetary taps once more in the form of Quantitative Easing.
But doubts had already started to creep in about the US economy and its ability to withstand tighter policy before Covid. US Treasury yields had started to fall (and prices rise) well before the virus struck.
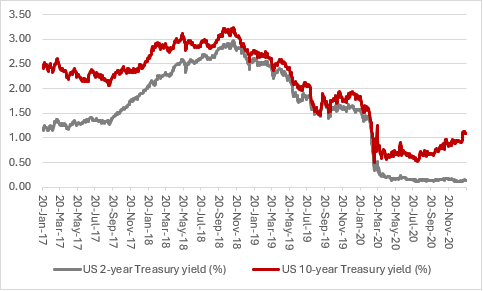
Source: LSEG Refinitiv data
Indeed, the 2s-10s yield curve briefly went negative in mid-2019, as if to signal the bond market had started to fear a recession. The global viral outbreak meant we would never find out if this view was correct, as it prompted a sharp, short downturn all on its own and rapid rate cuts and a return to QT meant Treasury yields started to rise from their lows (and prices started to fall from their highs) in 2020.
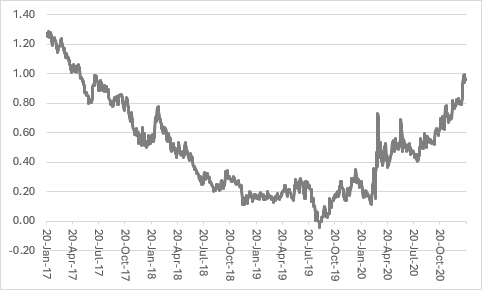
Source: LSEG Refinitiv data
There is still a case to be made that the US is long overdue a recession, since it has not had one since 2007-09’s Great Financial Crisis, but if anything the Treasury market seems concerned about either America overheating, or borrowing too much, or both, given the rise in yields seen in the past six months or so.
Higher yields, if they persist, could start to weigh on the US economy. Bigger interest bills could crimp the Federal government when it comes to spending or tax cuts, while higher mortgage, auto loan and credit card bills would dampen consumer spending. From an investment point of view, high yields on Treasuries could start to persuade investors to take less risk with equities if bonds start to offer more attractive, guaranteed returns (at least in nominal terms). In this scenario, the Fed’s Mr Powell could again start to feel some heat from the White House, in a re-run of 2017-21, but right now the message from the bond market is very different from four years ago.
Cryptocurrencies
Even allowing for a wicked correction from late 2017 to mid-2019, Bitcoin had a belting run during the first Trump presidency, as it surged to almost $56,000 from less than $1,000. Given Gary Gensler’s hasty departure from the Securities and Exchange Commission, Trump’s deregulation drive and the launch of the $TRUMP and $MELANIA meme coins, it seems likely that cryptocurrencies will remain an area of lively market activity this time around.
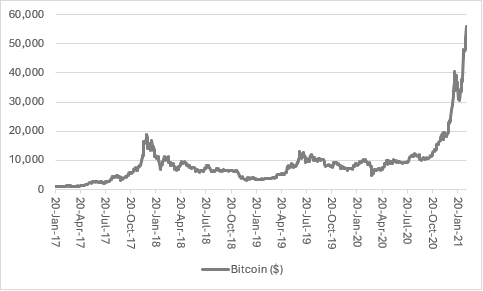
Source: LSEG Refinitiv data
To what degree Bitcoin’s surge in 2020 was down to fiscal and monetary stimulus in response to Covid-19, as investors sought stores of value in the case of rampant cheque-writing and money printing, is a matter for debate, but ultra-loose policy may have contributed.
Animal spirits could have just as powerful an effect this time around, but the meme token surge may only feel like fun for investors if their prices keep going up – and up and up. If they start going down – and down and down – then someone, somewhere will be losing money and there is a risk that capital is being misallocated, with potentially deleterious effects for the wider economy.

Written by:
Russ Mould
Investment Director
Russ Mould is AJ Bell's Investment Director. He has a Master's degree in Modern History from the University of Oxford and more than 30 years' experience of the capital markets.
Ways to help you invest your money
Put your money to work with our range of investment accounts. Choose from ISAs, pensions, and more.
Let us give you a hand choosing investments. From managed funds to favourite picks, we’re here to help.
Our investment experts share their knowledge on how to keep your money working hard.
Related content
- Fri, 13/06/2025 - 11:30
- Mon, 09/06/2025 - 10:43
- Fri, 06/06/2025 - 11:25
- Fri, 30/05/2025 - 13:55