
The thirteenth modern-day ‘bull market’ in America’s S&P 500 may give way to the thirteenth ‘bear market,’ although the benchmark has started to try and return to safety.
Bear markets occur when a market drops over 20% from its peak price, while a bull market is the rising counterpart. The good news is that bear markets tend to be much shorter than bull ones, even if they can be nasty.
The S&P 500 has dipped in and out of bear market territory this week, finding some respite as the 90-day pause on certain tariffs was put in place.
| Bear markets in the S&P 500 since 1950 | ||||||
|---|---|---|---|---|---|---|
| Start | Finish | Duration (days) | Start price | End price | Decline | |
| 1 | 03-Aug-56 | 22-Oct-57 | 445 | 50 | 39 | (22.0%) |
| 2 | 13-Dec-61 | 26-Jun-62 | 195 | 73 | 52 | (28.8%) |
| 3 | 14-Feb-66 | 07-Oct-66 | 235 | 94 | 73 | (22.3%) |
| 4 | 29-Nov-68 | 26-May-70 | 543 | 108 | 69 | (36.1%) |
| 5 | 11-Jan-73 | 04-Oct-74 | 631 | 120 | 62 | (48.3%) |
| 6 | 28-Nov-80 | 12-Aug-82 | 622 | 141 | 102 | (27.7%) |
| 7 | 25-Aug-87 | 19-Oct-87 | 55 | 337 | 225 | (33.2%) |
| 8 | 16-Jul-90 | 11-Oct-90 | 87 | 369 | 295 | (20.1%) |
| 9 | 24-Mar-00 | 09-Oct-02 | 929 | 1527 | 777 | (49.1%) |
| 10 | 09-Oct-07 | 09-Mar-09 | 517 | 1565 | 677 | (56.7%) |
| 11 | 19-Feb-20 | 23-Mar-20 | 33 | 3386 | 2237 | (33.9%) |
| 12 | 03-Jan-22 | 12-Oct-22 | 282 | 4797 | 3577 | (25.4%) |
| 13 | 19-Feb-25 | To date* | 47 | 6144 | 5062 | (17.6%) |
| Average | 381 | (33.6%) | ||||
Source: LSEG Refinitiv data. *As of the close on 7 April 2025
If the current market downturn sticks around, then the average bear market in the S&P 500 since 1950 has lasted 381 days and knocked a third off the value of the index.
However, historically, the more significant the bull market gain is before the drop, the bigger the drop can be.
Bear markets of the past
The bull market gains of 1990-2000 and 2002-2007 were followed by two significant bear markets, not least as valuations had become very stretched relative to historic averages.
As a result, the bear markets of 2000-03 and 2007-09 were much deeper and longer than average. Bear markets which are driven by recessions and weaker corporate earnings, as they were, tend to be worse on average, especially when the starting point comes when earnings expectations are high, valuations are high, and emotions seem to be factoring into investment decisions.
In the last five years, the S&P 500’s price to earnings ratio reached a new peak, although it backed off quickly following the Covid pandemic. But the ratio has been on the rise again and touched 30 times price to earnings in 2024.
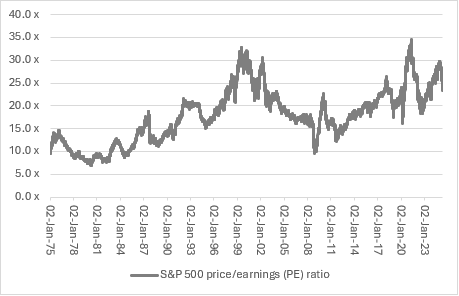
Source: LSEG Refinitiv data
Attractive valuations
The UK’s FTSE 100 is down by less than 10% from its end-of-day peak of 8,871 on 3 March, to suggest that the combination of a lower valuation and lower expectations relative to the US market is providing holders of UK stocks with some greater degree of downside protection.
And it may ultimately be valuation that helps investors draw a line in the sand.
Longtime investor and author Jim Rogers noted that, ‘Nearly every time I have strayed from the herd, I have made a lot of money. Wandering away from the action is the way to find the new action.’
One thing which might just keep investors in check and stop them from piling in straight away is the knowledge that markets do fall hard and fast when bears are in charge. As buyers and optimists panic and throw in the towel, an average bear market has suffered two-thirds of the total decline in the final third of their duration.
| The final third of bear markets in the S&P since 1950 | ||||||
|---|---|---|---|---|---|---|
| Start | Finish | Duration (days) | Start price | End price | Decline | % of total bear decline |
| 26-May-57 | 22-Oct-57 | 148 | 47 | 39 | (17.0%) | 77.4% |
| 22-Apr-62 | 26-Jun-62 | 65 | 69 | 52 | (24.6%) | 85.6% |
| 20-Jul-66 | 07-Oct-66 | 78 | 86 | 73 | (15.1%) | 67.7% |
| 26-Nov-69 | 26-May-70 | 181 | 93 | 69 | (25.8%) | 71.5% |
| 07-Mar-74 | 04-Oct-74 | 210 | 97 | 62 | (36.1%) | 74.7% |
| 16-Jan-82 | 12-Aug-82 | 207 | 116 | 102 | (12.1%) | 43.6% |
| 30-Sep-87 | 19-Oct-87 | 18 | 322 | 225 | (30.1%) | 90.6% |
| 12-Sep-90 | 11-Oct-90 | 29 | 323 | 295 | (8.7%) | 43.2% |
| 03-Dec-01 | 09-Oct-02 | 310 | 1,130 | 777 | (31.2%) | 63.6% |
| 17-Sep-08 | 09-Mar-09 | 172 | 1,156 | 677 | (41.4%) | 73.0% |
| 12-Mar-20 | 23-Mar-20 | 11 | 2,481 | 2,237 | (9.8%) | 29.0% |
| 10-Jul-22 | 12-Oct-22 | 94 | 4,459 | 3,577 | (19.8%) | 77.8% |
| 23-Mar-25 | To date* | 16 | 5,668 | 5,062 | (10.7%) | 60.7% |
| Average | (22.7%) | 66.5% | ||||
Source: LSEG Refinitiv data. *As of the close on 7 April 2025
Such capitulation may be the ‘buy’ signal that contrarians crave.
Whether they will get it when the S&P 500 trades on 19 times forward earnings for 2025 and 16.5 times for 2026, multiples that are still not cheap by historic standards, remains to be seen – and those valuations assume 14% earnings growth this year and 15% next, assumptions which a trade war or economic slowdown would bring into question.
Source: Standard & Poor’s data, analysts’ consensus forecasts, company accounts

Written by:
Russ Mould
Investment Director
Russ Mould is AJ Bell's Investment Director. He has a Master's degree in Modern History from the University of Oxford and more than 30 years' experience of the capital markets.
Ways to help you invest your money
Put your money to work with our range of investment accounts. Choose from ISAs, pensions, and more.
Let us give you a hand choosing investments. From managed funds to favourite picks, we’re here to help.
Our investment experts share their knowledge on how to keep your money working hard.