Archived article
Please note that tax, investment, pension and ISA rules can change and the information and any views contained in this article may now be inaccurate.

Following two strong non-farm payrolls reports, investors seem convinced that a US rate rise is almost a certainty when the US Federal Reserve meets on 15-16 December.
For the moment, US markets seem equally content to believe America’s economy is strong enough to withstand a rate rise.
If this proves to be the case, US stocks may still do well in 2016, as growth is hard to find and American assets attract cash on the basis its economy is doing less badly than others. History also shows that the US market does worst, on average, going into and coming out of a first rate rise in a new cycle. The graphic below shows how the S&P 500 has done on average after the first rate increase in the past seven cycles going back to 1971.
Uncertainty means S&P 500 tends to do worst going into and coming out of a first rate rise, on average

Source: Thomson Reuters Datastream
NOTE: Past performance is not a guide to future performance and some investments need to be held for the long term.
So long as the economy keeps firing and company profits keep growing, US stocks do seem to gather their nerve – although those preconditions are important.
The prospect of a rise in the dollar may also lure in UK-based investors, as a potential extra bonus anyone buying into this scenario is spoiled for choice when it comes to picking a fund, actively or passively run, with which to access the market.
Best performing US Large-Cap Blend Equity OEICs over the past five years
| OEIC | ISIN | Fund size £ million | Annualised five-year performance | Twelve-month Yield | Ongoing charge | Morningstar rating |
| Fidelity American Special Situations W (Acc) | GB00B89ST706 | 728.0 | 15.4% | 0.5% | 0.95% | ***** |
| Fidelity America Y (Acc) USD | LU0318939179 | 5,377.4 | 15.0% | n/a | 1.14% | ***** |
| JP Morgan US Select I (Net Acc) | GB0031835225 | 288.6 | 14.6% | 0.9% | 0.60% | ***** |
| JP Morgan America Equity C (Acc) USD | LU0129459060 | 921.4 | 14.5% | n/a | 1.14% | ***** |
| AXA Rosenberg American Z (Acc) | GB0007460149 | 190.0 | 14.3% | 1.1% | 0.78% | **** |
Source: Morningstar, for US Large-Cap Blend Equity category. Where more than one class of fund features only the best performer is listed.
Best performing North American investment trusts over the past five years
| Investment Trust | EPIC | Market cap £ million | Annualised five-year performance | Dividend yield | Gearing | Ongoing charge * | Discount to NAV | Morningstar rating |
| North Atlantic Smaller Companies | NAS | 322.1 | 16.8% | n/a | 0% | 1.14% | -17.1% | ***** |
| JP Morgan US Smaller Companies | JUSC | 101.4 | 16.6% | n/a | 7% | 1.73% | -2.4% | *** |
| JP Morgan American | JAM | 771.3 | 13.3% | 1.2% | 11% | 0.68% | -4.4% | ***** |
| North American Income | NAIT | 260.2 | 8.6% | 3.9% | 9% | 1.04% | -10.9% | *** |
| Jupiter US Smaller Companies | JUS | 142.3 | 7.6% | n/a | 0% | 1.01% | -13.4% | **** |
Source: Morningstar and the AIC, for North America and North American Smaller Companies Categories. * Includes performance fee
Best performing US Large-Cap Blend Equity ETFs over the past five years
| ETF | EPIC | Market cap £ million | Annualised five-year performance | Dividend yield | Fund Ongoing Charge | Morningstar rating | Replication method |
| iShares Core S&P 500 (GBP) | CSP1 | 8,584.5 | 14.9% | n/a | 0.07% | ***** | Physical |
| iShares MSCI USA (GBP) | CU1 | 332.6 | 14.2% | n/a | 0.33% | ***** | Physical |
| HSBC S&P 500 | HSPD | 1,228.1 | 14.1% | 1.7% | 0.09% | ***** | Physical |
| Lyxor S&P 500 D (USD) | LSPU | 1,107.2 | 14.1% | 1.6% | 0.15% | ***** | Synthetic |
| db x-trackers S&P 500 ETF 1C (GBP) | XSPX | 1,102.5 | 14.0% | n/a | 0.20% | ***** | Synthetic |
Source: Morningstar, for US Large-Cap Blend Equity category. Physical ETFs only.
Where more than one class of fund features only the best performer is listed.
Range of options
It is unlikely the Fed will strike too strident a tone as the economic picture in the US is far from clear-cut.
Yes, the non-farm payrolls have been good and unemployment has come rattling down, but jobs data are lagging indicators. It takes time for a firm to feel confident and profitable enough to hire and then go through the process of finding the right people.
US unemployment is falling but this is a lagging indicator
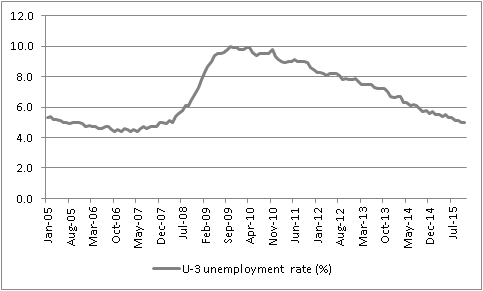
Source: www.bls.gov
NOTE: Past performance is not a guide to future performance and some investments need to be held for the long term.
Concurrent indicators like industrial production, retail sales and durable goods orders offer murkier picture, as the year-on-year growth trends for all three in this graphic illustrate:
Concurrent indicators such as retail sales, durable goods order and industrial production remain mixed

Source: Thomson Reuters Datastream, www.census.gov
NOTE: Past performance is not a guide to future performance and some investments need to be held for the long term.
Lead indicators like manufacturing sentiment surveys look gloomier still. This chart looks at the trend in new orders from the Richmond, Philadelphia, Dallas, Kansas and New York Federal Reserve surveys.
Lead indicators like new orders in sentiment surveys are still weak

Source: Thomson Reuters Datastream
NOTE: Past performance is not a guide to future performance and some investments need to be held for the long term.
Hot flows
The Fed may raise rates all the same, simply because not doing so would damage to its credibility, if September’s downward lurch in markets following a decision not to do anything is any guide – and frankly if it cannot tighten monetary policy after seven years of ultra-loose rates and a $3 trillion-plus expansion of the Fed’s balance sheet, we really are in a pickle and the S&P 500 probably shouldn’t be near the 2,000 level.
The removal of some uncertainty could also help sentiment, especially if investors get a firm steer on policy for 2016 (although this seems unlikely to this column).
Equally, the lesson of the last five years has been to follow the money. The US roared ahead when the Fed was running its QE scheme and the same could be said for the UK. Both equity markets have found the going tougher since the Bank of England and the Fed stopped adding to their programs in 2012 and 2014 respectively.
Since then, Japan and Europe have taken the lead, generating superior total equity market returns (in local currency terms, at least), buoyed by QE schemes launched in April 2013 and March 2015.
Japan’s QE scheme continues to drag the Tokyo market higher

Source: Bank of Japan, St. Louis Federal Reserve database, Thomson Reuters Datastream
NOTE: Past performance is not a guide to future performance and some investments need to be held for the long term.
Europe’s QE scheme is also boosting the Stoxx Europe 600 index

Source: European Central Bank, Thomson Reuters Datastream
NOTE: Past performance is not a guide to future performance and some investments need to be held for the long term.
With America possibly on the road to tightening, recent history would suggest US stocks are due a stickier patch, or at least a period of lagging Japan and Europe – although that of course assumes that investors and clients believe central banks’ ability to influence markets is as strong as ever.
Russ Mould
AJ Bell Investment Director

Written by:
Russ Mould
Investment Director
Russ Mould is AJ Bell's Investment Director. He has a Master's degree in Modern History from the University of Oxford and more than 30 years' experience of the capital markets.
Ways to help you invest your money
Put your money to work with our range of investment accounts. Choose from ISAs, pensions, and more.
Let us give you a hand choosing investments. From managed funds to favourite picks, we’re here to help.
Our investment experts share their knowledge on how to keep your money working hard.
Related content
- Mon, 16/06/2025 - 10:53
- Fri, 13/06/2025 - 10:47
- Fri, 13/06/2025 - 10:25
- Wed, 11/06/2025 - 09:38