Archived article
Please note that tax, investment, pension and ISA rules can change and the information and any views contained in this article may now be inaccurate.

Production disruption in Canada, Venezuela, Nigeria, Libya and Iraq, coupled with relatively steady demand, is helping drag oil back toward the $50-a-barrel.
Brent crude and West Texas Intermediate oil are both back at nearly $50 a barrel

Source: Thomson Reuters Datastream
Investment cuts, falling drilling activity and a long-awaited decline in US oil inventories is also helping to persuade the market that the worst is over for the black stuff, after its plunge from around $110 in 2014 to this year’s winter low of below $30.
US oil inventories have started to decline on a week-by-week basis

Source: US Energy Information Administration
Regrettably the oil price is never just the result of simple supply-and-demand economics, as there is a geopolitical overlay here –
- Within OPEC, Saudi Arabia and Iran are bitter rivals and have different economic agendas
- OPEC continues to try and reassert its authority over the oil price by making life as hard as it can for the upstart US shale producers
- Any sign of cross-border military conflict in the Middle East could easily spark off a sudden surge in crude
This dimension may deter investors from taking too strong, or active, a view on oil, given the number of imponderables. Equally, crude will have to enter almost everyone’s calculations in some way, shape or form, given its influence upon global growth and inflation (and potentially interest rates), as well as certain countries, indices and sectors.
For the moment, markets seem to be treating rising oil prices as good news, perhaps as it suggests the economic environment improving, is helpful in the fight against deflation and also staves off the risk of a credit event at the banks. Note how the UK banks sector has slavishly followed oil for the past couple of years:
Banks are enjoying oil’s rally as this may lessen the danger of loans to energy firms going bad

Source: Thomson Reuters Datastream
NOTE: Past performance is not a guide to future performance and some investments need to be held for the long term.
If the recovery in oil prices proves sustainable then there could be a number of potential winners from an investment perspective, although they all come with different risk and return profiles. Investors can then assess whether any of them fit with their overall strategy, investment goals, target returns, time horizon and appetite for risk.
Equally, if oil rolls back over and heads back toward $30 for whatever reason, “risk off” may become the order of the day once more, assuming the patterns of the past two to three years are maintained.
Weighty considerations
Any investor with exposure to the domestic UK equity market is taking a view on oil, whether they like or not, at least to some degree. Oil stocks represent around 12% of the FTSE 100’s market cap, as well as 6% of its forecast aggregate profits and 19% of expected dividend payments in 2016, according to consensus analysts’ forecasts. They are also expected to generate a hefty 28% of the index’s forecast earnings growth for 2016 and 37% for 2017 – and the higher oil prices go, the greater the contribution.
Oil remains a highly influential sector within the FTSE 100
| Percentage of FTSE 100 | |||||||
| Market cap | Pre-tax profit | 2016 E | 2017 E | Dividends | 2016 E | 2017 E | |
| Financials | 19% | Financials | 30% | 29% | Financials | 21% | 23% |
| Consumer Staples | 20% | Consumer Staples | 18% | 16% | Oil & Gas | 19% | 21% |
| Consumer Discretionary | 12% | Consumer Discretionary | 14% | 12% | Consumer Staples | 14% | 14% |
| Oil & Gas | 12% | Industrial goods & services | 10% | 9% | Health Care | 10% | 9% |
| Industrial goods & services | 9% | Health Care | 8% | 7% | Consumer Discretionary | 9% | 9% |
| Health Care | 9% | Oil & Gas | 6% | 12% | Mining | 7% | 3% |
| Telecoms | 6% | Telecoms | 4% | 4% | Industrial goods & services | 6% | 7% |
| Mining | 6% | Utilities | 4% | 4% | Telecoms | 6% | 7% |
| Utilities | 4% | Mining | 4% | 6% | Utilities | 5% | 5% |
| Real estate | 1% | Real estate | 1% | 1% | Real estate | 1% | 1% |
| Technology | 1% | Technology | 1% | 1% | Technology | 0% | 0% |
Source: Digital Look, analysts’ consensus estimates
NOTE: Past performance is not a guide to future performance and some investments need to be held for the long term.
In acknowledgement of this influence, some investors may seek to embrace it, if they feel oil can go higher, by taking broad-brush exposure to UK equities.
This can be simply done in a number of ways
UK equity tracker fund
BlackRock UK 100 Equity tracker is an OIEC and comes with an OCF of just 0.06%. BP and Shell both feature in its list of top five holdings with a combined weighting of around 7.1%. The SPDR FTSE All Share ETF performs the same function and also has top-five weightings in BP and Shell. Its OCF is 0.2%.
Actively managed UK equity fund
A lot of the top performers in the UK Equity Income category have low weightings in the oils - indeed their recent outperformance will be based on this to some degree - so they have a big decision to take, as to whether to jump back in or not.
Two funds which already have top-ten positions in both BP and Shell are Schroder UK Alpha Income and Royal London UK Equity Income, so they would be logical beneficiaries if oil continued to rally and dragged the share prices of the majors along for the ride.
The table below looks at the oil weightings and positions in BP and Shell of the ten best performing UK Equity Income funds over the last five years.
Best performing UK equity income funds over the last five years still have limited oil exposure
| ISIN | Fund size(million) | Annualised 5-year performance | 12-month yield | Ongoing charge | |
| MI Chelverton UK Equity Income Fund B (Inc) | GB00B1FD6467 | £ 439.4 | 14.2% | 5.3% | 0.92% |
| Unicorn UK Income B (Inc) | GB00B00Z1R87 | £ 692.9 | 12.3% | 4.7% | 0.81% |
| Evenlode Income B (Acc) | GB00B40SMR25 | £ 523.8 | 12.0% | 3.3% | 0.95% |
| Royal London UK Equity Income M | GB00B3M9JJ78 | £ 1,768.8 | 11.8% | 4.9% | 0.66% |
| Henderson Global Care UK Income I (Inc) | GB0005030373 | £ 154.6 | 11.7% | 4.6% | 0.84% |
| Standard Life UK Equity Income Unconstrained Retail I (Acc) | GB00B79X9673 | £ 1,120.3 | 11.5% | 4.1% | 1.15% |
| Troy Trojan Income O (Acc) | GB00B01BP176 | £ 2,577.9 | 11.0% | 4.1% | 1.02% |
| Rathbone Income Fund Institutional (Inc) | GB00B7FQLQ43 | £ 1,216.4 | 10.8% | 4.0% | 0.80% |
| Schroder UK Alpha Income Z (Inc) | GB00B073JS25 | £ 657.0 | 10.6% | 5.1% | 0.92% |
| Threadneedle UK Equity Alpha Income ZNI | GB00B88P6D76 | £ 914.2 | 10.6% | 5.0% | 0.88% |
Source: Morningstar, for UK Large-Cap Blend Equity category.
NOTE: Past performance is not a guide to future performance and some investments need to be held for the long term.
Where more than one class of fund features only the best performer is listed.
The next table performs the same function but for investment trusts. Only one of the top ten performers over five years – James Henderson’s Lowland – has a top-ten position in both Shell and BP, so this one could get a boost if oil keeps going or suffer if it slips back.
Best performing UK equity income investment trusts over the last five years still have limited oil exposure
| Investment company | EPIC | Market cap (million) | Annualised 5-year performance * | Dividend yield | Ongoing charges ** | Energy weighting | Top 10 Shell | Top 10 BP |
| Diverse Income | DIVI | £ 358.1 | 16.2% | 3.0% | 1.26% | 2.0% | No | No |
| Finsbury Growth & Income | FGT | £ 800.0 | 14.4% | 2.0% | 0.78% | 0.0% | No | No |
| British & American | BAF | £ 22.5 | 13.3% | 9.1% | 3.64% | 0.0% | No | No |
| Edinburgh | EDIN | £ 1,362.8 | 12.1% | 3.5% | 0.61% | 3.6% | No | Yes |
| Investment Company | INV | £ 17.2 | 11.9% | 6.5% | 2.56% | 0.0% | No | No |
| Lowland | LWI | £ 342.1 | 11.3% | 3.5% | 0.62% | 8.0% | Yes | Yes |
| Perpetual Income and Growth | PLI | £ 912.4 | 11.2% | 3.7% | 0.65% | 3.4% | No | Yes |
| Standard Life Equity Income | SLET | £ 189.7 | 10.7% | 3.5% | 0.94% | 0.0% | No | No |
| Troy Income & Growth | TIGT | £ 196.5 | 10.5% | 3.5% | 1.01% | 6.0% | Yes | No |
| Invesco Income Growth | IVI | £ 157.2 | 10.4% | 3.8% | 0.88% | 3.8% | No | No |
Source: Morningstar, for UK Large-Cap Blend Equity category.
NOTE: Past performance is not a guide to future performance and some investments need to be held for the long term.
Energy-themed fund
One option to consider here is the ETFS US Energy Infrastructure ETF (EPIC code MPLI). Listed on the London Stock Exchange, this tracker follows a basket of 24 American energy pipeline, storage and logistics firms, a lot of whose share prices fell hard and fast alongside the actual oil price. The tracker offers a dividend yield of 5.4% and could make further progress if oil makes additional gains.
ETFS US Energy Infrastructure ETF is rallying alongside oil

Source: Thomson Reuters Datastream
NOTE: Past performance is not a guide to future performance and some investments need to be held for the long term.
Oil tracker
Investors may want to avoid stock specific risk and just follow the oil price. ETFS Crude Oil ETC (EPIC code CRUD) tracks the US benchmark, West Texas Intermediate, and ETFS Brent Crude (EPIC code BRNT) the equivalent European oil benchmark.
Note that both trackers follow a basket of oil futures prices, not the spot price, and both use synthetic replication (derivatives) to achieve this. Besides movements in the oil futures, investors are also exposed to the roll yield and collateral yield for their total return on investment, so this added complication may deter some investors from getting involved.
Oil stocks
More adventurous, risk-tolerant investors may seek to take on stock-specific risk in the form of the UK’s two majors, BP and Shell.
Both stocks were hit hard by the slump in oil so it would be reasonable to expect their share prices to respond positively if oil does forge a sustained price recovery, not least as this would give greater comfort on their plump-looking dividend yields, which are in the 7-8% region, but with thin earnings cover of well below one times.
This suggests BP and Shell need the oil price to make further marked gains to ensure their dividends are completely safe in the long run, even as they continued to cut costs and capital expenditure to support profits and cash flows.
In the near term they can fund their shareholder distributions through the disposal of assets or raising of fresh debt, although neither is desirable over too long a period, as this could do damage to the firms’ balance sheets and competitive positions.
At least this risk is familiar to the market.
BP trades near 30-year lows on a share price relative basis, when compared to the FTSE All-Share index. The stock did trade lower on a relative basis back in 1992, when then chairman Bob Horton sanctioned a dividend cut so if investor confidence in the safety of the shareholder distribution grows then the shares may benefit.
Equally a fresh decline in oil would hardly be helpful to their cause, or dividend-paying capacity.
BP trades near its 30-year relative share price low

Source: Thomson Reuters Datastream
NOTE: Past performance is not a guide to future performance and some investments need to be held for the long term.
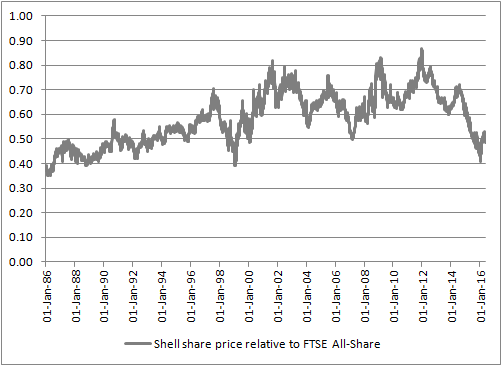
Shell has rallied away from near 30-year relative lows, but still trades near the troughs seen during the last two recessions.
Shell’s share price relative stands near lows seen in prior recessions
Source: Thomson Reuters Datastream
NOTE: Past performance is not a guide to future performance and some investments need to be held for the long term.
Less well developed, pure play producers like FTSE 250 firms Cairn and Tullow could also benefit, but the operational and exploration risks are higher here, and then the riskiest oil plays are the AIM-quoted junior explorers which may not even be producing or have a find, but whose share prices could welcome more positive sentiment toward their industry.
Fixed-income option
Fixed-income investors will doubtless be watching the bonds issued on the London Stock Exchange's ORB platform with interest. Issued with a 5% coupon the 2020 Premier Oil bond offers a yield to maturity of 13.8% and the EnQuest 5.5% 2022 paper offers 15.8% as both trade well below par, owing to fears about how a long run of low oil prices could leave their balance sheets looking very stretched. If oil makes great gains and holds on to them this could ease the pressure on both firms, boosting the price of their shares and their bonds but the very high coupons involved make it clear that the risks are very high and neither is suitable for widows or orphans.
Russ Mould
AJ Bell Investment Director

Written by:
Russ Mould
Investment Director
Russ Mould is AJ Bell's Investment Director. He has a Master's degree in Modern History from the University of Oxford and more than 30 years' experience of the capital markets.
Ways to help you invest your money
Put your money to work with our range of investment accounts. Choose from ISAs, pensions, and more.
Let us give you a hand choosing investments. From managed funds to favourite picks, we’re here to help.
Our investment experts share their knowledge on how to keep your money working hard.
Related content
- Fri, 13/06/2025 - 11:30
- Mon, 09/06/2025 - 10:43
- Fri, 06/06/2025 - 11:25
- Fri, 30/05/2025 - 13:55