Archived article
Please note that tax, investment, pension and ISA rules can change and the information and any views contained in this article may now be inaccurate.

The old strategy of “Sell in May” has proved a failure thus far in 2016, as stock and bond markets have both continued to make progress, and record-breaking progress at that in some cases, with America’s S&P 500 equity index reaching new all-time highs and bond yields around the world setting new lows.
Gold and silver have advanced to two-year highs, creating what could be seen as a rosy picture, although it is confusing to have so many asset classes doing well at the same time.
- Traditionally, stocks do well when markets are confidently pricing in economic growth and healthy increases in corporate profits and dividends.
- Usually, bonds do well when the opposite is the case, when markets are nervous and seeking safety as they fear a recession and plunging profits and lower dividends.
- Gold and silver can do well during times of inflation or just outright market panic.
It is therefore odd that all three are doing well almost in unison. For the moment the narrative that is dominating sentiment is that of further monetary stimulus (lower interest rates and maybe more QE) from central banks and a swing in (Governments’) fiscal policy from austerity to stimulus.
Only time will tell whether this scenario plays out – the Bank of Japan, European Central Bank and Bank of England all declined to act last time around, but the market is already looking ahead to the next policy decisions from Tokyo and London.
The fact that markets are baying for this stimulus (and for the US Federal Reserve to do nothing when it meets) is a bit of a give-away that the global economy is not doing as well as hoped – that may be one reason why bonds are doing well.
The prospect of more cheap money sloshing around helps explain why stocks are looking perky and also why the precious metals have popped higher – gold in particular is often seen as a hedge against central bank profligacy and wanton creation of money in an attempt to stoke inflation.
Investors therefore need to keep an eye on the upcoming central bank meetings, but this prospect of intervention from either the monetary authorities or the fiscal ones (Governments) mean that trying to take a strong view on how markets develop is trickier than ever.
One option therefore is to look toward multi-asset or multi-manager funds, to glean exposure to a broad spread of asset classes, to cover all potential eventualities (recovery or recession, inflation, deflation or stagflation), in exchange for the annual fee.
The table below lists the top ten performers over the past five years.
Best performing GBP Moderate Allocation OEICs over the past five years
| OEIC | ISIN | Fund size £ million | Annualised five-year performance | Twelve-month Yield | Ongoing charge | Morningstar rating |
| Polar Capital Income Opportunities B1 | IE00B4TCHT23 | 121.3 | 9.4% | 5.0% | 0.91% | ***** |
| Fidelity MoneyBuilder Balanced Y (Inc) | GB00B7XJFZ07 | 577.5 | 9.3% | 4.3% | 0.67% | ***** |
| Premier Multi-Asset Distribution C Net (Inc) | GB00B40RNW10 | 942.6 | 9.0% | 5.0% | 1.42% | **** |
| Vanguard Life Strategy 60% Equity A (Acc) | GB00B3TYHH97 | 1,546.6 | 8.8% | 1.9% | 0.24% | ***** |
| Premier Multi-Asset Monthly Income C Net (Inc) | GB00B7GGPC79 | 519.7 | 8.7% | 5.3% | 1.42% | ***** |
| Royal London Sustainable Diversified C | GB00B844WJ68 | 295.5 | 8.7% | 2.2% | 0.78% | ***** |
| Aviva Investors Multi-Asset IV R3 GBP (Acc) | GB00B72W9168 | 259.2 | 8.7% | 1.4% | 0.58% | ***** |
| Kames Ethical Cautious Managed B (Acc) | GB00B7V2CD05 | 558.3 | 8.5% | 2.3% | 0.79% | ***** |
| Vanguard Life Strategy 40% Equity A (Acc) | GB00B3ZHN960 | 984.1 | 8.0% | 1.3% | 0.24% | ***** |
| Standard Life Dynamic Distribution Retail 1 (Inc) | GB00B7JNXM18 | 356.6 | 8.0% | 4.1% | 0.82% | ***** |
Where more than one class of fund features only the best performer is listed.
NOTE: Past performance is not a guide to future performance and some investments need to be held for the long term.
The second table then shows their exposures by asset class, to help investors decide whether they are comfortable with the fund’s strategy or not – property exposure may be something to watch, for example, while investors may well have strong views on the suitability of equities, bonds, commodities and cash in the context of their particular overall strategy, target returns, time horizon and appetite for risk.
Current asset allocations at the best performing GBP Moderate Allocation OEICs over the past five years
| Equities | Bonds | Cash | Other | |
| Polar Capital Income Opportunities B1 | 56.7% | 26.2% | 5.6% | 11.5% |
| Fidelity MoneyBuilder Balanced Y (Inc) | 64.3% | 27.0% | 7.9% | 0.8% |
| Premier Multi-Asset Distribution C Net (Inc) | 43.9% | 26.2% | 7.4% | 22.6% |
| Vanguard Life Strategy 60% Equity A (Acc) | 60.4% | 37.5% | 0.5% | 1.5% |
| Premier Multi-Asset Monthly Income C Net (Inc) | 38.0% | 23.8% | 11.9% | 26.4% |
| Royal London Sustainable Diversified C (Inc) | 51.7% | 39.6% | 2.8% | 5.9% |
| Aviva Investors Multi-Asset IV R3 GBP (Acc) | 68.2% | 10.6% | 4.9% | 16.3% |
| Kames Ethical Cautious Managed B (Acc) | 46.0% | 38.9% | 13.7% | 1.4% |
| Vanguard Life Strategy 40% Equity A (Acc) | 40.7% | 56.9% | 0.7% | 1.8% |
| Standard Life Dynamic Distribution | 49.2% | 28.2% | 5.7% | 16.9% |
Source: Fund providers' factsheets, Morningstar
NOTE: Past performance is not a guide to future performance and some investments need to be held for the long term.
Bouncing back
One notable feature of the summer so far has been the resilient nature of the UK equity market, especially in light of the EU referendum vote, the full implications of which (negative or positive) will only become clear in time.
The chart below shows how the FTSE 100 has broken out of a classically bear-market channel, topped and tailed by a depressing sequence of lower new highs and lower new lows.
While this column prefers the fundamentals of corporate profits, cash flows and dividends to the darker arts of technical analysis, it has to accept that many traders will be watching the picture with interest.
If the FTSE 100 can move with conviction above the trio of peaks seen last summer at 6,747, 6,796 and then 6,845 then a technical analyst would argue a move toward the April 2015 all-time closing high of 7,104 could be on the cards.
FTSE 100 is trying to break free from a classic bear-market sequence of lower highs and lower lows

Source: Thomson Reuters Datastream
NOTE: Past performance is not a guide to future performance and some investments need to be held for the long term.
Timing the market is a dangerous game and if anyone is in doubt the best plan is probably to do nothing, so as to avoid racking up unnecessary dealing expenses, but now seems like a good time to return to this column’s preferred indicators to see whether markets are rightly bouncy and becoming (potentially dangerously) bubbly, intoxicated by the prospect of more cheap central bank liquidity.
Famous five
These preferred indicators are transportation indices, the copper price, small cap stocks’ performance, market volatility and (the ultimate arbiter of any investment return) valuation.
To take them in order:
- The transportation indices. The old theory goes that if the transports are not performing, the industrials can’t either, as if nothing is being shipped, nothing is being sold. The good news is the FTSE All-Share Transportation index is marching higher and at least keeping base with the broader FTSE All-Share benchmark (which in some ways is a nice surprise, given the presence of earnings plodder Royal Mail in the sector and the problems which beset the airlines sub-sector at the moment)
British transportation stocks look to be on the right track

Source: Thomson Reuters Datastream
NOTE: Past performance is not a guide to future performance and some investments need to be held for the long term.
In America, the Dow Jones Transportation index also looks to be heading in the right direction, though it is making heavier weather of it and can hardly be said to be leading the Dow Jones Industrials.
This is a trend which needs to be watched, especially as recent freight and trucking data in the US has been mixed and Volvo last week offered clear evidence of a big fall in new heavy truck orders in the second quarter of the year – and that is the sort of trend that can usher in downturns not recoveries.
US transportation stocks are making less compelling progress
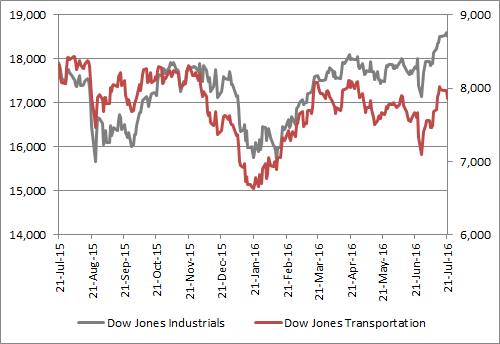
Source: Thomson Reuters Datastream
NOTE: Past performance is not a guide to future performance and some investments need to be held for the long term.
- Doctor Copper. The industrial metal is a great barometer for global economic health. It has rallied from January’s six-year low but only in fits and starts. A sustained increase in copper prices would help ease fears that we are sliding toward a deflationary downturn.
Dr Copper is yet to fully convince it is back to full health

Source: Thomson Reuters Datastream
NOTE: Past performance is not a guide to future performance and some investments need to be held for the long term.
- Small caps. Market minnows are an excellent indicator of risk appetite- they tend to outperform when investors are bullish and fall faster than the broader market when they are bearish. The UK’s FTSE Small Cap and America’s Russell 2000 have both rallied hard from their lows but have yet to get where they began the year. Bulls will want to see these benchmarks start to consistently tick higher and even set new highs for 2016 as a sign that confidence is truly blossoming.
Small caps are making welcome progress after a tough first half
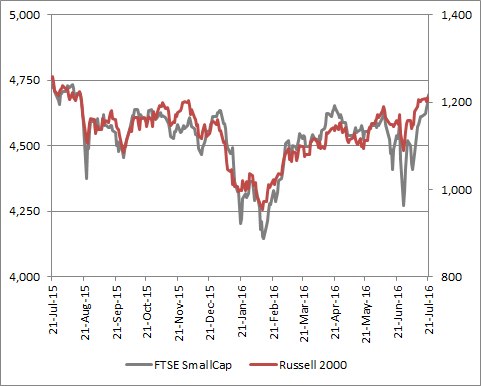
Source: Thomson Reuters Datastream
NOTE: Past performance is not a guide to future performance and some investments need to be held for the long term.
- Market volatility. A little more conversation and little less action is a welcome sign. After five straight days of open-to-close movements of more than 2% in the aftermath of the referendum vote, the FTSE 100 has moved forward quietly, with minimal fuss.
Volatility can be the friend of the investor – it can provide chances to sell stock expensively or buy it cheaply – but history shows that stock indices progress best when they make serene progress and a series of modest gains and tend to fare less well when trading is choppy and there are big swings up and down.
This calm is to be welcomed, especially after 27 open-to-close movements of at least 1% in January and February alone, the choppiest start to any year for at least two decades. Further peaceful gains, in incremental steps, would further encourage this is a bull run and not some frenzied bubble that is primed to burst, assuming historic trends repeat themselves.
A period of calm and less market volatility is looking like a good thing, at least for the moment

Source: Thomson Reuters Datastream
NOTE: Past performance is not a guide to future performance and some investments need to be held for the long term.
- Valuation – and especially the dividend yield. In the end, the valuation paid for an asset is the ultimate arbiter of the investment returns made on it. Valuation metrics using forecast earnings can be unreliable, as those forecasts are often wrong, so dividend yield can offer more comfort. Management teams are reluctant to cut the shareholder payouts as this tends to hit a share price hard and potentially their own wallets. At the time of writing, the FTSE All-Share is yielding 3.54%, compared to a 10-year Gilt yield of 0.96% - that’s a 260 basis point (2.6%) premium. Granted, the risks are much higher with stocks than bonds, dividend cuts remain a danger and bond yields could rise in the event of an inflation surprise - but the All-Share has only twice offered a premium yield of 2% or more since 2008 and on both occasions the stock market promptly made healthy gains.
UK stocks still appear to offer a substantial premium yield relative to Government bonds

Source: Thomson Reuters Datastream
NOTE: Past performance is not a guide to future performance and some investments need to be held for the long term.
None of these five signals look to be flashing danger, although one or two are borderline amber (US transport and Dr Copper) and the green glow from small caps could be stronger.
All five could prove useful indicators as we approach St Leger day (10 September on this occasion), the traditional end to the summer lull and this column will endeavour to keep a close eye on the quintet and inform investors of any potentially significant changes in trend.
Russ Mould
AJ Bell Investment Director

Written by:
Russ Mould
Investment Director
Russ Mould is AJ Bell's Investment Director. He has a Master's degree in Modern History from the University of Oxford and more than 30 years' experience of the capital markets.
Ways to help you invest your money
Put your money to work with our range of investment accounts. Choose from ISAs, pensions, and more.
Let us give you a hand choosing investments. From managed funds to favourite picks, we’re here to help.
Our investment experts share their knowledge on how to keep your money working hard.
Related content
- Mon, 16/06/2025 - 10:53
- Fri, 13/06/2025 - 10:47
- Fri, 13/06/2025 - 10:25
- Wed, 11/06/2025 - 09:38