Archived article
Please note that tax, investment, pension and ISA rules can change and the information and any views contained in this article may now be inaccurate.

The Bank of England has cut interest rates for the first time in seven years, jacked up its Quantitative Easing programme to £435 billion, flagged a further rate cut is to come and also introduced a new lending mechanism for banks, to try and ensure that the full benefits of this cheap money are passed right through to corporates and consumers.
Given that Governor Mark Carney has spent most of the last three years talking of rate hikes (even if the 2013 “forward guidance” initiative did not last long) and the last six weeks teasing markets with the prospect of a cut, investors must therefore draw four lessons from this chain of events:
- Heed only what central banks do and ignore what they say; this is pertinent with regard to the US Federal Reserve’s persistent jawboning about higher interest rates this year or next and the US central bank’s three remaining meetings this year. The chances of a Fed hike in 2016 must now be very limited indeed.
- It is important to focus on not just one economic indicator, but a series of them and in the context of other data. In addition, it is important to look at the most useful figures –those that are lead indicators, such as sentiment surveys, and concurrent indicators, such as retail sales and industrial output, rather than lagging ones, such as GDP or unemployment, which are next to useless for investment purposes.
- Global growth remains flaccid and inflation subdued, at least in the near-term. Otherwise the European Central Bank and Bank of Japan would not be running flat-out QE programmes, the Bank of England would not be easing and the Fed keen to do as little as possible. This has implications for portfolio asset allocation, as low inflation traditionally favours fixed-income over stocks. Yet the doubling-down on QE and calls from Mr Carney for fiscal stimulus point to an inflation trade as the way to go, creating a dilemma.
- Interest rates are unlikely to go higher, potentially for some time to come. This also has implications for asset allocation, especially as investors who want income are going to have to take on more risk than they would like, via corporate bonds, emerging market government debt or equities, to harvest the coupons or dividends they require.
With regard to the final point, the UK equity market, as benchmarked by the FTSE All-Share, is offering a far higher yield than the risk-free rate provided by the 10-year Government bond, or Gilt, as this column has flagged for the past two weeks.
This appears to be providing support to the UK stock market at a time of some political and economic uncertainty and lower rates (and lower bond yields) will only make the quest for reliable income more acute.
A good UK equity income fund manager should be able to help with this search, picking out stocks where dividends are safe (and capable of growing) and dodging the potential accidents where a dividend may be cut.
There is a good choice of actively-run open and closed-ended funds and the leading performers over the last five years in the UK equity income category are listed below.
Best performing UK Equity Income OEICs over the past five years
| OEIC | ISIN | Fund size £ million | Annualised five-year performance | Twelve-month Yield | Ongoing charge | Morningstar rating |
| Evenlode B (Acc) | GB00B40SMR25 | £823.5 | 14.9% | 2.95% | 0.95% | ***** |
| Marlborough Multi Cap Income P (Inc) | GB00B908BY75 | £1,396.9 | 13.8% | 5.30% | 0.80% | ***** |
| MI Chelverton UK Equity Income B (Inc) | GB00B1FD6467 | £386.0 | 13.8% | 5.46% | 0.92% | ***** |
| Royal London UK Equity Income M GBP (Acc) | GB00B3M9JJ78 | £1,534.3 | 13.7% | 4.30% | 0.66% | ***** |
| Henderson Global Care UK Income I (Inc) | GB0005030373 | £158.3 | 12.6% | 4.34% | 0.67% | ***** |
Source: Morningstar, for UK Large-Cap Blend Equity category.
Where more than one class of fund features only the best performer is listed.
NOTE: Past performance is not a guide to future performance and some investments need to be held for the long term.
Best performing UK equity income investment companies over the last five years
| Investment company | EPIC | Market cap (£ million) | Annualised five-year performance * | Dividend Yield | Ongoing charges ** | Discount to NAV | Gearing | Morningstar rating |
| Chelverton Small Companies Dividend | SDV | 32.0 | 20.2% | 3.9% | n/a | -0.2% | 31% | n/a |
| Diverse Income | DIVI | 337.5 | 15.8% | 3.2% | 1.26% | 0.2% | 0% | ***** |
| Edinburgh | EDIN | 1,365.8 | 13.6% | 3.5% | 0.61% | -2.0% | 17% | ***** |
| Perpetual Income & Growth | PLI | 968.8 | 12.4% | 3.4% | 1.06% | -4.5% | 18% | ***** |
| Invesco Income Growth | IVI | 163.2 | 12.2% | 3.7% | 0.81% | -9.5% | 4% | ***** |
Source: Morningstar, The Association of Investment Companies, for the UK Equity Income category
* Share price. ** Includes performance fee
NOTE: Past performance is not a guide to future performance and some investments need to be held for the long term.
There are also lower-cost passive options available via exchange-traded funds (ETFs), although there is a scanty choice of dedicated equity income trackers, so the table below looks at the broader large-cap category.
Best performing UK Large-Cap Blend Equity ETFs over the past five years
| ETF | EPIC | Market cap £ million | Annualised five-year performance | Dividend yield | Fund Ongoing Charge | Morningstar rating | Replication method |
| db x-trackers FTSE All-Share UCITS ETF (DR) 1D | XASX | 111.45 | 7.76% | 4.04% | 0.40% | *** | Physical |
| Lyxor UCITS ETF FTSE All Share | LFAS | 11.34 | 7.59% | n/a | 0.40% | *** | Synthetic |
| Lyxor UCITS ETF FTSE 100 C-GBP | L100 | 505.5 | 7.22% | n/a | 0.15% | *** | Synthetic |
| iShares Core FTSE 100 UCITS ETF (Dist) | ISF | 4059.54 | 7.07% | 4.13% | 0.07% | *** | Physical |
| db x-trackers FTSE 100 UCITS ETF (DR) Inc 1D | XUKX | 185.5 | 7.04% | 3.13% | 0.30% | *** | Physical |
Source: Morningstar, for UK Large-Cap Blend Equity category.
Where more than one class of fund features only the best performer is listed.
NOTE: Past performance is not a guide to future performance and some investments need to be held for the long term.
Useful and useless indicators
The bad news for the Bank of England is the two best-looking economic indicators are lagging ones – GDP growth and unemployment.
GDP growth has to be a lagging indicator because the data can only be collected after a quarter has ended and it then takes time to finalise the figures – the initial estimate is then subject to two subsequent revisions.
To offer some encouragement, GDP growth accelerated to 2.2% year-on-year in the second quarter, the second consecutive improvement in momentum.
The UK showed an acceleration in GDP growth for the April-to-June quarter

Source: ONS, Trading Economics
NOTE: Past performance is not a guide to future performance and some investments need to be held for the long term.
Perhaps the most heartening economic statistic of all at the moment comes in the form of a record employment rate of 74.4% and the May unemployment rate of 4.9%, the lowest figure since 2005.
The UK’s unemployment rate stands at an 11-year low

Source: ONS, Trading Economics
NOTE: Past performance is not a guide to future performance and some investments need to be held for the long term.
The problem is all of these numbers are inherently backward-looking and of little use for investment purposes. It takes time for firms to feel confident enough to hire extra staff and go through the candidate selection and signing process, so job gains in May probably reflected decisions taken in the winter.
Concurrent indicators
There is greater value to be found in concurrent indicators such as retail sales and factory and manufacturing output.
The messages here remain mixed. Neither data set is suggestive of recession or a rapid upturn.
Retail sales have been volatile but have held up relatively well overall, despite the mild winter, wet spring and summer and appalling efforts of England’s football team during the UEFA European Championships.
UK retail sales have been resilient, if volatile, over the past year

Source: ONS, Trading Economics. Seasonally adjusted
NOTE: Past performance is not a guide to future performance and some investments need to be held for the long term.
However, the headline figure printed refers to volumes, not revenues. June’s 4.3% volume gain – the forty-third consecutive increase - only translated into a 1.5% revenue advance, and this persistent price deflation continues to make life difficult for retailers and the big grocery chains in particular.
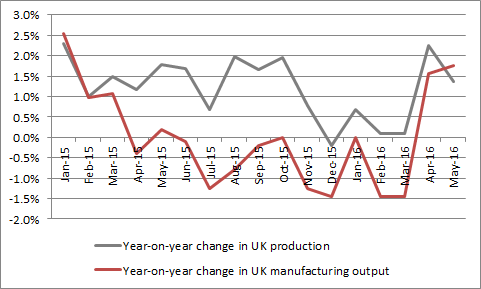
Manufacturing and industrial output appear to have bounced back after a tough winter and it is to be hoped that sterling’s post-EU referendum slide can help here.
Manufacturing and industrial output trends improved in spring
Source: ONS
NOTE: Past performance is not a guide to future performance and some investments need to be held for the long term.
Recession watch
If the lagging indicators are strong and the concurrent ones mixed, regrettably the weakest trends are visible in the leading indicators, the monthly sentiment surveys, or purchasing managers’ indices (PMIs).
For the month of July, each of manufacturing, services and construction went under 50 in the UK. Scores above that mark tend to suggest respondents are optimistic about the future the readings below it that they are pessimistic – the former are therefore usually interpreted to mean economic growth is on the way, the latter that a downturn or even a recession may be coming.
If sentiment indicators are any guide, the UK economy is slowing down

Source: CIPS/Markit
NOTE: Past performance is not a guide to future performance and some investments need to be held for the long term.
The PMIs are not hard economic data or infallible, so they need to be treated with a degree of caution.
But they had peaked long before the EU referendum result on 24 June and have for some time therefore sent out a downbeat message. This may be why the Bank of England acted as it did on Thursday 4 August.
Central bank band-aid
Stock and bond markets had already begun to warm to the prospect of a fresh rate cut.
Our analysis of 11 prior rate cutting cycles all the way back to 1965 shows how the FTSE All-Share has historically tended to gather steam coming out of the first interest rate cut, heartened by the prospect of the monetary medicine:
UK equities have, on average, responded favourably to a fresh interest-rate cutting cycle (but with two recent exceptions)
| Rate cut cycle | FTSE All-Share performance after first interest rate cut | ||||||
| From | To | From | To | 3 months | 6 Months | 1 Year | 2 years |
| 03-Jun-65 | 04-May-67 | 7.00% | 5.50% | -3.5% | 6.1% | 12.1% | 3.9% |
| 21-Mar-68 | 02-Sep-71 | 8.00% | 5.00% | 19.1% | 30.7% | 26.4% | 10.5% |
| 07-Jan-74 | 08-Mar-76 | 13.00% | 9.00% | -16.6% | -30.3% | -57.3% | 10.5% |
| 19-Nov-76 | 17-Oct-77 | 15.00% | 5.00% | 25.4% | 46.8% | 64.1% | 64.1% |
| 03-Jul-80 | 29-Jun-84 | 17.00% | 8.88% | 6.7% | 7.2% | 17.9% | 16.6% |
| 20-Mar-85 | 17-May-88 | 13.88% | 7.38% | -1.9% | 0.3% | 30.2% | 59.9% |
| 08-Oct-90 | 08-Feb-94 | 14.88% | 5.13% | -4.5% | 15.8% | 18.5% | 13.3% |
| 13-Dec-95 | 06-Jun-96 | 6.63% | 5.69% | 1.4% | 5.7% | 9.0% | 33.0% |
| 08-Oct-98 | 10-Jun-99 | 7.50% | 5.00% | 27.8% | 35.5% | 33.0% | 40.8% |
| 08-Feb-01 | 10-Jul-03 | 6.00% | 3.50% | -5.1% | -11.7% | -17.3% | -42.0% |
| 06-Dec-07 | 05-Mar-09 | 5.75% | 0.50% | -10.1% | -8.6% | -38.8% | -19.8% |
| Average | 3.5% | 8.9% | 8.9% | 17.3% | |||
Source: Thomson Reuters Datastream, Bank of England
NOTE: Past performance is not a guide to future performance and some investments need to be held for the long term.
Analysis of the three rounds of QE launched in 2009, 2011 and 2012 also suggest the stock market would welcome a fresh dose, even if QE’s value to the wider economy remains a matter of heated debate.
UK equities welcomed all three rounds of QE launched by the Bank of England since 2009
| FTSE All-Share performance after first QE move | ||||||||
| From | To | Amount | 3 months | 6 Months | 1 Year | 2 years | 3 months | |
| QE-I | 05-Mar-09 | 07-Jan-10 | £200 bn | 26.6% | 39.0% | 59.6% | 73.4% | 4.7% |
| QE-II | 06-Oct-11 | 10-May-12 | £125 bn | 6.2% | 9.2% | 12.5% | 26.1% | 5.3% |
| QE-III | 07-Jun-12 | 08-Nov-12 | £50 bn | 6.9% | 9.3% | 19.6% | 29.7% | 9.1% |
| Average | 13.2% | 19.2% | 30.6% | 43.1% | 6.4% | |||
Source: Thomson Reuters Datastream, Bank of England
NOTE: Past performance is not a guide to future performance and some investments need to be held for the long term.
Yet the experiences of 2001-03 and 2007-09 in particular show that the averages must not be taken completely at face value.
The Bank of England aggressively cut interest rates on both occasions and share prices plunged anyway on each occasion, as the combination of stretched valuations (relative to history) and disappointing corporate profit and cash flow numbers (relative to market expectations) proved too powerful.
Race for yield
The last two UK bear markets therefore offer a timely reminder of what really matters. Ultimately, it is company profits and cashflows that determine the worth of a security and investors’ returns from those securities are in turn then determined by the valuation they pay to access them. The lower the price paid, the better the chance of a decent return over time.
This final chart compares annual GDP growth, with annual profits growth at the FTSE 100 and then annual changes in that index.
A small change in GDP translated into much wider gains or losses in earnings (owing to operational and financial gearing at corporations and also the fact that around 70% of FTSE 100 members’ sales come from beyond the UK) and substantial swings in stock markets, as confidence waxes and wanes and investors seek to pay a higher or lower multiple for higher or lower earnings, according to how confident they feel and where we are in the economic cycle.
UK GDP data look to have a tenuous link to stock market performance

Source: ONS, Thomson Reuters Datastream, Company accounts, Digital Look
NOTE: Past performance is not a guide to future performance and some investments need to be held for the long term.
This is something investors might like to bear in mind. Through efficiencies, a little inflation and perhaps some pricing power well-run firms should be able to grow profits (and dividends) at a GDP-plus rate over the long term – and equity investing is therefore a 10 or 20-year process (and more), particularly when it comes to the harvesting (and reinvestment) of dividends.
By contrast, second-guessing economic data and central banks for short-term trading is an exercise fraught with timing risk (and potentially laden with unwelcome frictional dealing costs).
Russ Mould
AJ Bell Investment Director

Written by:
Russ Mould
Investment Director
Russ Mould is AJ Bell's Investment Director. He has a Master's degree in Modern History from the University of Oxford and more than 30 years' experience of the capital markets.
Ways to help you invest your money
Put your money to work with our range of investment accounts. Choose from ISAs, pensions, and more.
Let us give you a hand choosing investments. From managed funds to favourite picks, we’re here to help.
Our investment experts share their knowledge on how to keep your money working hard.
Related content
- Mon, 16/06/2025 - 10:53
- Fri, 13/06/2025 - 10:47
- Fri, 13/06/2025 - 10:25
- Wed, 11/06/2025 - 09:38