
Even after a wobbly start to March, the FTSE 100 continues to confound both the doubters and those who think that stock markets start and end in New York.
The index has, thus far, added to its 6% capital return and double-digit percentage total return, as the US has started to lag on the global stage.
Whether this trend continues or not remains to be seen, but the UK can at least claim to offer a potential angle for income-seekers in particular to research, while its prospective price/earnings ratio of 13 times for 2025 represents a historically large discount to the US market.
This could conceivably provide a downside cushion should Trump, trade and tariffs continue to befuddle markets and upside potential, especially if the UK itself ever shakes off its economic funk.
How much does the FTSE 100 yield?
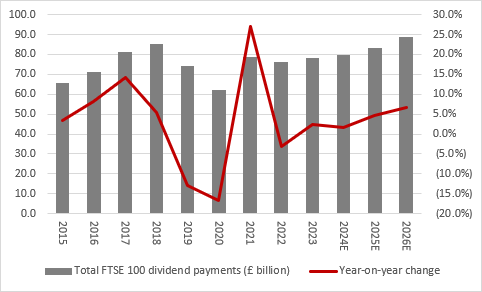
The prospective dividend yield of 3.7% for 2025, based on an aggregate of the forecasts for each FTSE 100 stock, is not as plump as the figure on offer at the start of recent years. That is a function of the index’s steady advance to a new all-time high in the first week of March.
Nevertheless, it is supplemented by a bounty of share buybacks. The final tally for 2024 looks likely to fall around £57 billion, almost on a par with 2022’s all-time high of £58.2 billion. FTSE 100 constituents have already declared buybacks worth £28.9 billion for this year, more than half last year’s total, in the first quarter alone.
Adding together the forecast dividend total of £83 billion to the planned buybacks gives a total cash return of £111.9 billion, some 5% of the FTSE 100’s total £2.2 trillion stock market valuation. That cash yield beats inflation, the 10-year gilt yield and the Bank of England base rate which, on balance, still seems set to go lower before it goes higher once more.
Source: Company accounts, Marketscreener, consensus analysts’ forecasts. Ordinary dividends only
Dividend growth still very concentrated
For income-seekers, the FTSE 100’s yield may be a key part of the UK stock market’s appeal, but investors must be aware of the relative degree of concentration risk within the UK’s headline index. Just 10 companies are forecast to pay out 53% of the total for 2025, at £43.9 billion, while the top 20 are expected to chip in £57.7 billion, or 70% of the estimated total.
The top 10 list includes two oil majors, drug developers, banks and consumer staples plays, and one apiece from the mining and utility sectors. This again highlights the importance of the miners, oils and financials to the overall trajectory of the FTSE 100’s profits and dividends.
In terms of dividend growth, 10 firms are expected to generate half of the forecast £3.7 billion increase in FTSE 100 dividend payments in 2025, with NatWest, Unilever and Glencore leading the charge.
Only Rio Tinto is currently expected to push through a dividend reduction of any magnitude and the price of iron ore could yet have a big say in that. The other forecast reductions, in sterling terms, are the result of share buybacks and lower share counts, not a reduction in the shareholder distribution.
2025E |
||||
|---|---|---|---|---|
| Ten biggest forecast dividend increases | £ million | Ten biggest forecast dividend decreases | £ million | |
| NatWest Group | 441 | Beazely | (2) | |
| Unilever | 301 | Smiths Group | (3) | |
| Glencore | 232 | Endeavour Mining | (8) | |
| BP | 197 | Schroders | (8) | |
| Admiral Group | 193 | Mondi | (11) | |
| Rolls Royce | 149 | HSBC | (16) | |
| British American Tobacco | 148 | WPP | (30) | |
| Lloyds | 145 | Vodafone | (35) | |
| GSK | 122 | Berkeley | (52) | |
| 3i | 121 | Rio Tinto | (219) | |
Source: Company accounts, Marketscreener, consensus analysts’ forecasts. Ordinary dividends only
Many dividend yields compare well to gilts
At the time of writing, Phoenix Group is the highest-yielding stock in the FTSE 100, followed by asset manager M&G and fellow life insurer Legal & General, with housebuilder Taylor Wimpey and then British American Tobacco next on the list.
There have been 139 dividend cuts across the current crop of FTSE 100 members in the past decade and even if 73 of those came in the covid-blighted years of 2019 and 2020 there were still 11 in 2024.
As such nothing can be taken for granted and investors need to look at the balance sheet and cash flow – and not just the profit and loss account and earnings cover – when assessing how safe a dividend may be. They will also need to assess the volatility of profits and, in the case of cyclical stocks whose earnings and cash flow are subject to the vagaries of the economic cycle, look at average earnings over a full cycle to see what degree of cover that provides.
2024E |
||||
|---|---|---|---|---|
| Company | Dividend yield (%) | Dividend cover (x) | Pay-out ratio (5) | Cut in last decade? |
| Phoenix Group | 9.8% | 0.30 x | 335% | 2016,2018 |
| M & G | 9.3% | 1.16 x | 86% | No |
| Legal and General | 8.9% | 1.17 x | 86% | No |
| Taylor Wimpey | 8.3% | 0.92 x | 109% | 2019 |
| British American Tobacco | 7.7% | 1.51 x | 66% | No |
| Land Securities | 7.3% | 1.98 x | 51% | 2019 |
| Aviva | 7.3% | 1.34 x | 75% | 2019 |
| Admiral Group | 7.0% | 1.16 x | 86% | 2016, 2021, 2022 |
| LondonMetric Property | 6.9% | 1.77 x | 57% | 2015 |
| Sainsbury | 6.1% | 1.67 x | 60% | 20215, 2016 |
| Average | 7.9% | 1.30 x | 101% | |
Source: Company accounts, Marketscreener, consensus analysts’ forecasts, LSEG Refinitiv data. Ordinary dividends only
A further rule of thumb states that any dividend yield which exceeds the risk-free rate by a factor of two may turn out to be too good to be true. The 10-year gilt yield is a good proxy for the risk-free rate. A dozen years of interest rates at near zero rendered the rule pretty useless but now monetary policy is returning to something akin to ‘normal’ it may regain some of its former relevance.
For the record, just one FTSE 100 firm currently offers a forecast dividend yield of 9.38% or more, or twice the 4.69% 10-year gilt yield that prevails at the time of writing, and that is Phoenix Group, though M&G is not too far away from that threshold.
Dividend dashboard explained
Each quarter, AJ Bell takes the forecasts for the FTSE 100 companies from all the leading City analysts and aggregates them to provide the dividend outlook for each company and the entire index. The data relates to the outlook for 2025 and 2026. Data correct as of 17 March 2025.
These articles are for information purposes only and are not a personal recommendation or advice. Past performance isn't a guide to future performance, and some investments need to be held for the long term. Forecasts are not a reliable indicator of future performance.

Written by:
Russ Mould
Investment Director
Russ Mould is AJ Bell's Investment Director. He has a Master's degree in Modern History from the University of Oxford and more than 30 years' experience of the capital markets.
Ways to help you invest your money
Put your money to work with our range of investment accounts. Choose from ISAs, pensions, and more.
Let us give you a hand choosing investments. From managed funds to favourite picks, we’re here to help.
Our investment experts share their knowledge on how to keep your money working hard.
Related content
- Fri, 13/06/2025 - 11:30
- Mon, 09/06/2025 - 10:43
- Fri, 06/06/2025 - 11:25
- Fri, 30/05/2025 - 13:55