A big rally from the 8 April lows means the NASDAQ Composite is now in the black for this month, while the S&P 500 is flat.
This may look to vindicate a ‘buy-on-the-dip’ strategy, and persuade the White House that all is still going to plan, but the Dow Jones Industrials is down and so is the Dow Jones Transports, so there remains the risk that tariffs and trade frictions drag the US economy off financial markets’ preferred track.
| Change since President Trump's inauguration | ||||
|---|---|---|---|---|
| Dow Jones Transports | Dow Jones Industrials | NASDAQ Composite | S&P 500 | |
| January* | (0.8%) | 2.4% | (0.0%) | 0.7% |
| February | (2.0%) | (1.6%) | (4.0%) | (1.4%) |
| March | (7.8%) | (4.2%) | (8.2%) | (5.8%) |
| April** | (8.5%) | (4.5%) | 0.5% | (1.5%) |
| To date | (17.9%) | (7.8%) | (11.4%) | (7.9%) |
Source: LSEG Refinitiv data. *From 20 January, inauguration day. **To 25 April.
The NASDAQ’s recovery may owe much to the tariff exemptions offered by the President to imported technology hardware, such as mobile devices and computers, and Trump’s potential use of trade deals to force other countries to reduce their digital sales taxes and ease regulation on companies such as Meta Platforms and Alphabet, the parent of Google.
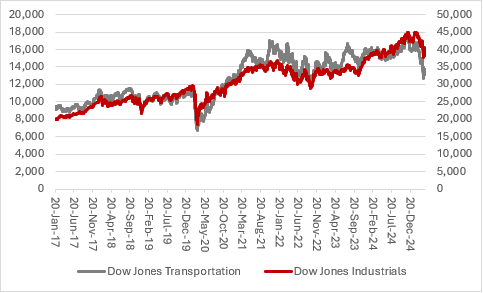
But the marked lag showed by the Dow Jones Industrials is telling, even if Apple and Microsoft are members of that thirty-stock benchmark index, and the truth behind the tale of the tape may lie with the twenty-member Dow Jones Transportation index.
What does the Dow Jones Transportation index show?
This owes much to Robert Rhea’s Dow Theory, which asserts that the Dow Jones Industrials – and the US economy - are unlikely to do well if the Dow Jones Transportation index is doing badly (and likely to thrive if it is doing well).
The premise is that if the economy is strong, then goods are being sold and thus manufacturers will have to make more and ship them to refill shelves. The opposite also holds true, in that if end-market sales are weak, then planes, trains, ships and trucks will be less active as manufacturers hold back on output as they wait for inventory to be digested.
Bulls of US equities will argue that the US economy is now very different from ninety years ago, since manufacturing now represents barely 10% of American economic output and consumption around two-thirds. In March 2025, manufacturing employed 12.8 million Americans, to provide 8% of jobs.
By contrast, while companies as such as Meta and Alphabet have large workforces they produce little that is tangible even though they provide services that are valued by many.
Nevertheless, manufacturing jobs and output still provide a strong multiplier effect, and the US stock market still clearly pays attention to the Dow Jones Transportation index, because the Dow Jones Industrials is going nowhere fast right now. Just as the Transports and the Dow slumped in the second half of 2018, as Trump ratcheted up tariffs during his first term, they are on the slide again now.

Source: LSEG Refinitiv data
Is the US still on track for growth?
The Atlanta Fed GDPNow service is forecasting a slight dip in US economic output in the first quarter of 2025 (excluding the impact of gold imports) and the economic data could be muddy and difficult to interpret for some time to come. Companies have looked to prepare for the introduction of tariffs by building inventory and consumers have bought in advance of them, too, at least where it is practical for them to do so. This could mean a pull-forward of demand and then a reduction in the second quarter and beyond, as more expensive goods and scrambled supply chains start to take their toll.
Evidence is already gathering of sharp drops in activity, and congestion, at ports such as the Port of Long Beach, a key destination for goods that are shipped from Shanghai. The first three months of the year look to have been strong, based on the total number of twenty-foot equivalent (TEU) containers that are entering and leaving the port.
However, the total number of empties has shot up, too, to hint at the supply chain friction that may be yet to come. Rising empty space smacks of weaker demand, especially for imports into the USA.
A collapse in US freight shipments, as measured by an index provided by CASS, offers more evidence of a potential slump in US trade activity, or at least dislocations caused by preparations for the introduction of tariffs. The year of 2018 showed a similar trend during the first Trump presidency.
Weakening truck tonnage data also hints at a softer US economy, but, again, the numbers may be muddy owing to the launch of tariffs on Canada, Mexico and China, and the steel, aluminium and car industries globally, and then the introduction of and subsequent delay to reciprocal tariffs and additional levies on China, and the confusion they and a growing number of exemptions are sowing.
Ways to help you invest your money
Put your money to work with our range of investment accounts. Choose from ISAs, pensions, and more.
Let us give you a hand choosing investments. From managed funds to favourite picks, we’re here to help.
Our investment experts share their knowledge on how to keep your money working hard.
Related content
- Tue, 29/04/2025 - 11:41
- Fri, 25/04/2025 - 14:52
- Wed, 23/04/2025 - 14:22
- Tue, 22/04/2025 - 10:44
- Thu, 17/04/2025 - 16:01

