Archived article
Please note that tax, investment, pension and ISA rules can change and the information and any views contained in this article may now be inaccurate.
 magazine
How to use the CAPE ratio

Nobel Prize winning economist Robert Shiller reckons the best way of assessing value in forward looking markets is to look to the past.
In 1988 he popularised the cyclically-adjusted price to earnings (CAPE) ratio, also known as the Shiller PE, to help investors decide if a stock, sector or market is trading at a premium or discount to its historical value.
Whereas a price to earnings (PE) ratio is calculated with one year’s earnings, CAPE uses the average over 10 years to avoid factoring short-term fluctuations in earnings into the assessment.
To calculate the CAPE, you divide the latest share price by the average earnings over the previous 10 years, which are adjusted for inflation.

Shares attended an event in September featuring Shiller. He pointed to the UK being an attractive investment because its CAPE ratio is low, while the weak pound and the investment flowing into companies are reasons for optimism.
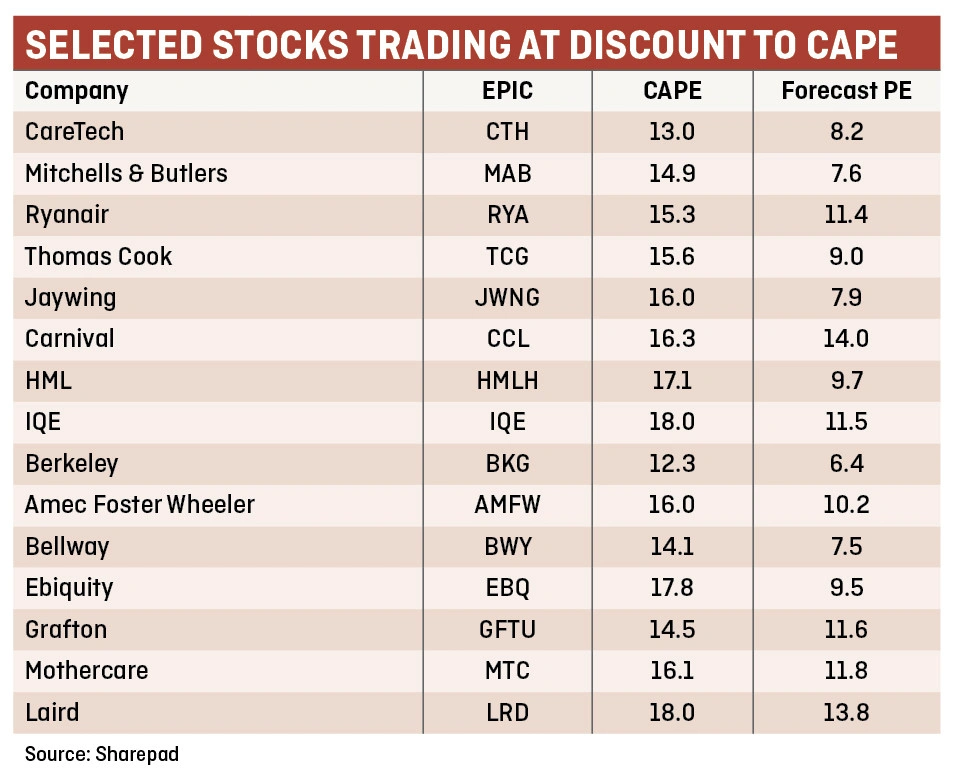
We have used SharePad’s stock screener to identify a list of stocks that look cheap using the CAPE methodology. They include social care provider CareTech (CTH:AIM), cruise giant Carnival (CCL), residential services specialist HML (HMLH:AIM) and compound wafer designer IQE (IQE:AIM).
Carnival’s discount to its historical average, for example, looks unjustified given analysts expect profit to grow by 10%
in 2017.
No guarantees
CAPE is based on historical data and past performance is no guarantee of future returns.
Digital marketing play Jaywing’s (JWNG:AIM) current discount to its long-term PE or CAPE ratio reflects the fact it started out as a buy-and-build venture when it floated on AIM in 2006. Therefore its early rating was inflated as it was only deriving earnings from a limited number of businesses.
Ryanair (RYA) looks a great buy at present, in our view, as it is trading on 11.4 times earnings versus a CAPE ratio of 15.3. Airline stocks are out of fashion at the moment due to weak demand as a result of terrorist activity in many parts of the world. Longer term we believe Ryanair will prosper as
it has done in the past.
Thomas Cook (TCG) is also down for similar reasons. We believe its strong brands and large market share will put it in a good position in time. It trades on nine times forward earnings versus a 15.6 average for the past 10 years.
Some companies might be trading below their CAPE or have a low CAPE for good reason.
Henry Boot (BHY) trades on 9.4 times earnings, well below its historical 17 average, using the CAPE approach. The company is linked to the fortunes of the construction and housebuilding industries, which are vulnerable to economic declines.
Pubs and restaurant group Mitchells & Butlers (MAB) is approximately half its historical average, as calculated by the CAPE ratio. That’s because it has spent years lagging the peer group and the market is slowly giving up hope the business can be fixed.
A CAPE, just like PE, should not be used in isolation. It is a part of an investor’s research arsenal and no investment decision should be made on the ratio alone.
For those looking to diversify the risk of investing in single companies or need help stock picking based on CAPE, there are ETFs available focusing on Europe or the US.
Ossiam ETF Shiller Barclays CAPE EU (CAPE) and Ossiam ETF Shiller Barclays CAPE US (CAPU) select sectors based on the CAPE ratio and share price momentum.
US stocks are overvalued relative to European equities, according to research produced by ETF Securities, and the situation could reverse over the remainder of the year.
A reversal of GDP performance and earnings trends between the two regions are two of the reasons Aneeka Gupta, equity and commodities strategist at the exchange-traded fund provider, is bullish on European stocks.
Gupta’s research also uses the CAPE ratio. It shows the European market, excluding the UK, trades on a CAPE ratio of 17 versus 24 in the US. That’s despite diverging fortunes in the two countries at an economic and corporate level.
Second quarter GDP in the EU surpassed the US after years of weaker performance, growing 1.6% versus 1.2% in the US. After years of adjustment, even economies like Spain are starting to grow at a decent pace again, improving the overall growth rate on the continent.
Earnings growth in Europe, excluding the UK, is also expected to turn positive in the third quarter of 2016 after 18 months of downgrades on the back of lower energy prices, Gupta says.
In the US, stock-market listed companies on aggregate are not expected to start delivering earnings per share improvements until the fourth quarter.
‘The important thing we believe is backing a reversal in this trend is the pick-up in GDP growth in Europe and the acceleration of that,’ Gupta says.
‘In addition, we feel the recovery in Europe is still in its early stages, compared to the US where the expansion has been running much longer. From our research, early stage recoveries tend to produce stronger stock market performance compared to those in the later stages.’

Important information:
These articles are provided by Shares magazine which is published by AJ Bell Media, a part of AJ Bell. Shares is not written by AJ Bell.
Shares is provided for your general information and use and is not a personal recommendation to invest. It is not intended to be relied upon by you in making or not making any investment decisions. The investments referred to in these articles will not be suitable for all investors. If in doubt please seek appropriate independent financial advice.
Investors acting on the information in these articles do so at their own risk and AJ Bell Media and its staff do not accept liability for losses suffered by investors as a result of their investment decisions.