Archived article
Please note that tax, investment, pension and ISA rules can change and the information and any views contained in this article may now be inaccurate.
One of the most intriguing facets of financial markets of the past two years has been the differing messages offered by bond yields and share prices.
The US bond market has been predicting a recession. The American stock market has instead priced in a cooling in inflation, a gentle economic landing and a pivot to interest rate cuts from central banks, with the result that the Dow Jones, S&P 500 and NASDAQ have set a series of all-time highs. But the mood music may now be changing.
The so-called yield curve in the US is no longer inverted, and history suggests that this is the point of greatest danger when it comes to both a recession and a stock market stumble, so it may be no coincidence that American share prices have shown increased volatility of late.
Usually, the yields on long-term bonds are higher than those on short-term paper. This is simply because lenders (or bond buyers) demand a higher return to compensate themselves for the increased scope for something to go wrong during the additional time, such as changes in interest rates, higher inflation or, at worst, a default by the issuer (or borrower).
The usual shape of the yield curve therefore goes from the bottom left of a screen to the top right, in a gently steepening path.
However, an inverted curve means long-term rates are lower than near-term ones. This means markets think that interest rate cuts are coming in response to a slowdown or recession. A shorthand version of this can be provided by comparing just the yield on two- and 10-year government bonds.
For the past two years, the US 2s-10s yield curve has been inverted – but the recession has not arrived.
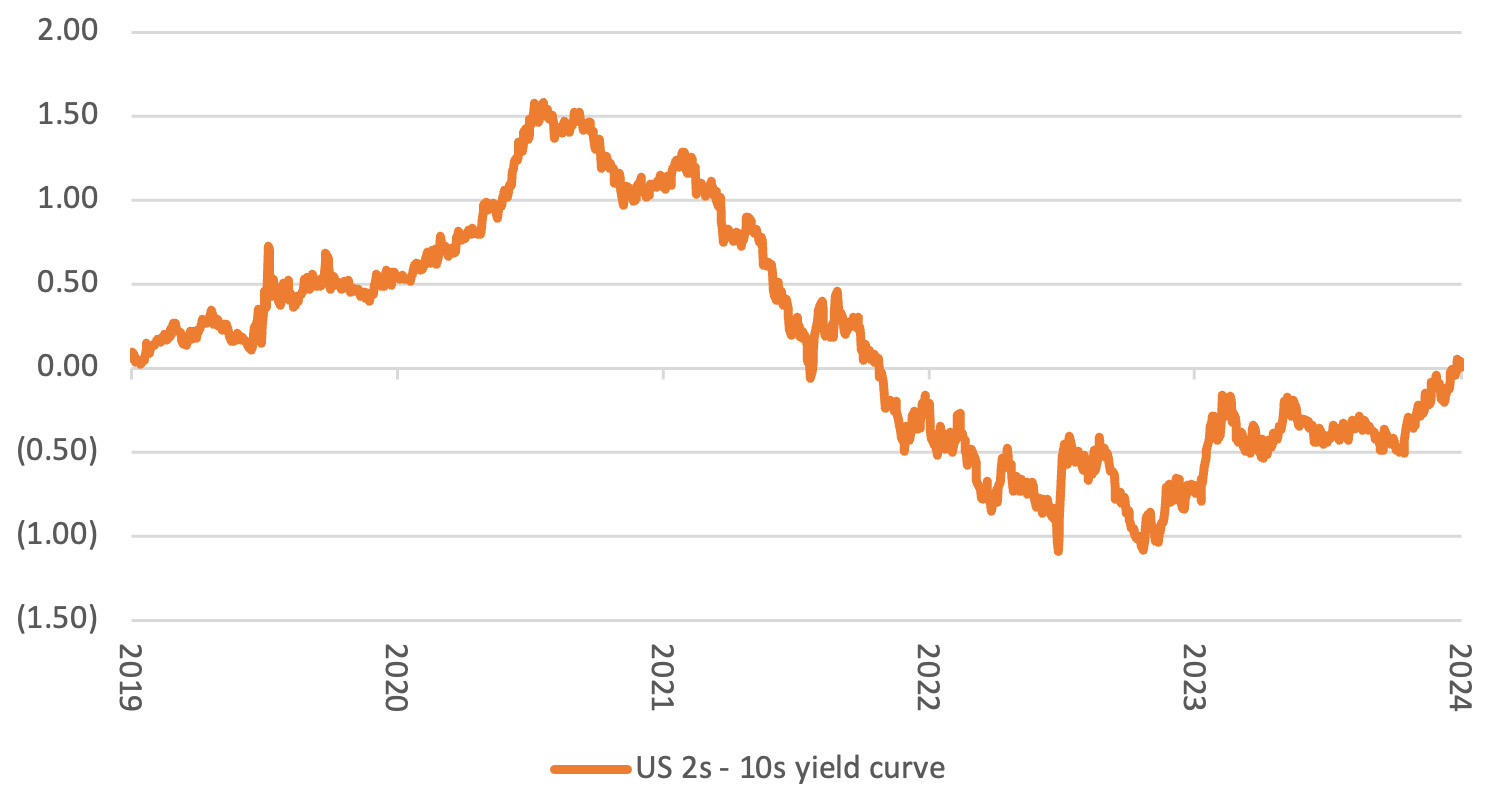
Source: LSEG Refinitiv data
The absence of that economic downturn, helped by massive fiscal stimulus from the Biden administration and what are still low interest rates from the US Federal Reserve, has pushed the US stock market to cast aside the bond market’s concerns.
But history suggests that share prices can encounter trouble once the 2s-10s curve uninverts and near-term bond yields fall faster than long-term ones. This is what fixed-income investors call a ‘bull steepener’ as the shape of the yield curve changes, sometimes quite dramatically.
Bonds may welcome a bull steepener, but equities are not always quite so sure.
This may be because an end to the inversion is often the real herald of a US recession as the Federal Reserve starts to cut interest rates, but too late to avert a slowdown.
The US recessions of 1980, 1981-82, 1990, 2001-02 and 2007-08 were all preceded by the yield curve steepening quite sharply, as benchmarked by the yield differential between two and ten-year US Treasuries.
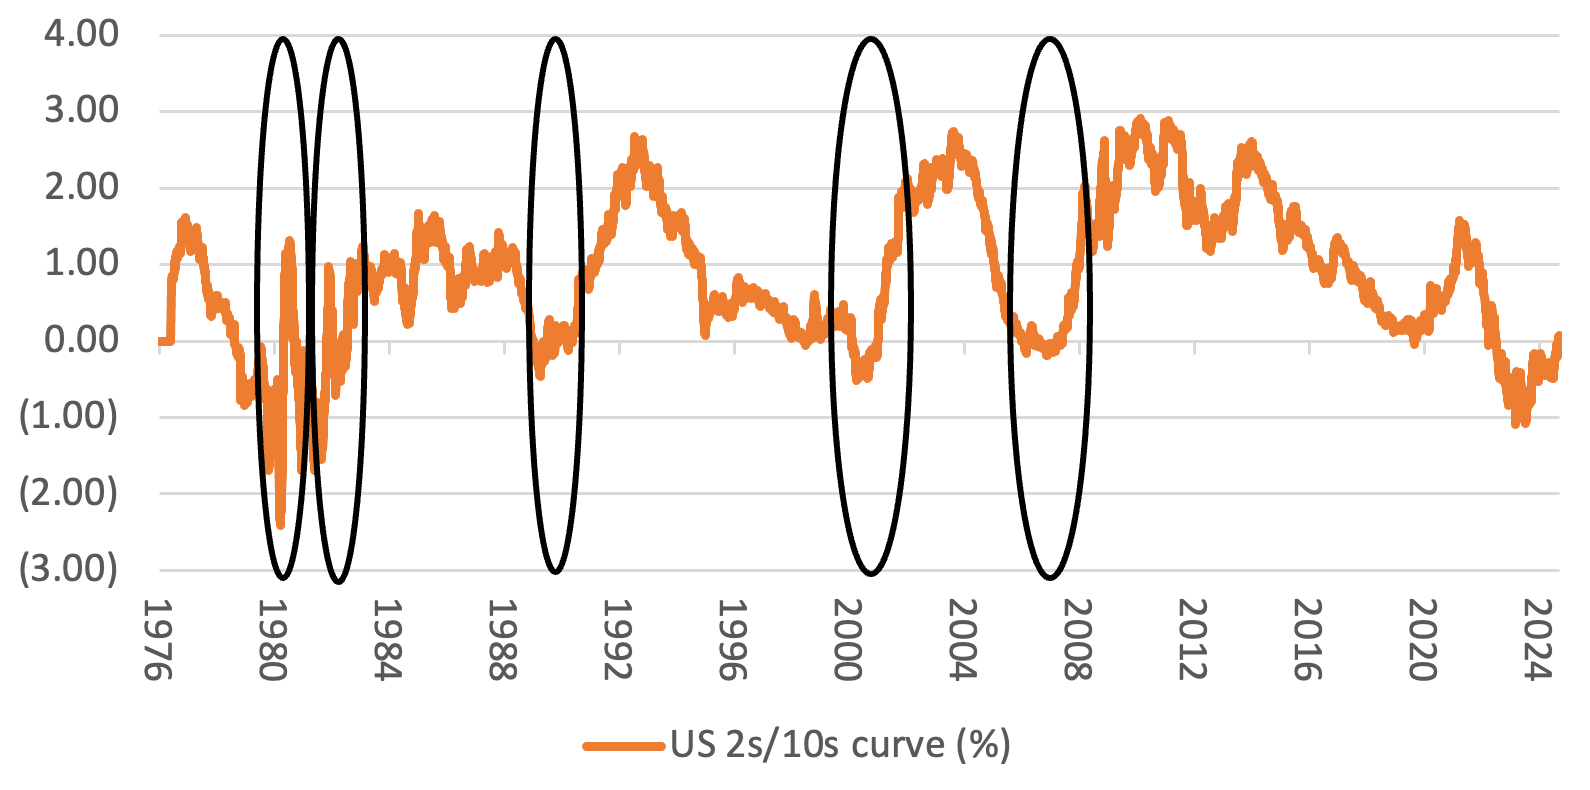
Source: LSEG Refinitiv data. Circles represent US recessions
The inversion this time has been a particularly long one and many have understandably dismissed it as a false signal. Sceptics may also be tempted to cast aside the precedents of 2000 and 2006-07, when a bull steepener in US Treasuries preceded both a recession and an equity bear market, especially as bull steepeners did not stop the S&P 500 in its tracks in 1980, 1981 or 1989-90, even though recession struck.
| S&P 500 performance after inversion ends | ||||
|---|---|---|---|---|
| Yield curve inversion | Days | 3 months | 6 months | 12 months |
| Oct 1978 - May 1980 | 622 | 14.9% | 20.9% | 25.8% |
| Sep 1980 - Oct 1981 | 406 | (2.7%) | 0.0% | 17.1% |
| Jan 1989 - Jun 1989 | 176 | 9.2% | 10.5% | 12.0% |
| Feb 2000 - Dec 2000 | 320 | (13.6%) | (8.1%) | (13.0%) |
| Aug 2006 - Mar 2007 | 219 | 4.0% | 6.3% | (7.4%) |
| Jul 2022 - Sept 2024 | 792 | N/A | N/A | N/A |
Source: LSEG Refinitiv data
Yet it may not pay to be too complacent.
Share prices turned choppy ahead of the US double-dip recession of the early 1980s and bear markets had set in before corporate earnings were pressured by a downturn and the Federal Reserve tried to ride to the rescue.
The S&P 500 fell by a quarter in 1981-82. It also suffered a wobble in late 1990, before it regained its poise.
The stock market downturns of 2000-02 and 2007-08 were much deeper, and more protracted, and one of the reasons why is that share prices had done so well beforehand. In contrast to the 1980s and 1990s, the S&P had kept on roaring upward, with the result that expectations were higher, valuations were higher and there was less downside protection once the downturn came.
Professor Robert Shiller’s cyclically adjusted price earnings (CAPE) ratio shows that US equities were trading on below 10 times earnings in the early 1980s and at around 15 times at the start of the 1990s. By 2000 the multiple exceeded 40 and was still 25 come 2007, so it was no wonder a recession was so badly received.
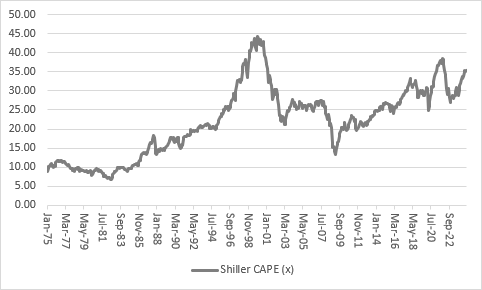
Source: http://www.econ.yale.edu/~shiller/data.htm
It may therefore be of some concern that US equities currently trade on 35 times earnings according to the Shiller research. The Shiller PE has never been an exact timing tool, and uninverted yield curves have thrown out the occasional false signal too, notably in mid-1982 and late-1990, but it would be no shock to see further share price volatility in the US, especially if markets’ preferred scenario of a cooling in inflation, a soft economic landing and interest rate cuts does not develop precisely as expected.
APPENDIX: The four types of yield curve
The yield curve changes shape according to variations in the yield on each individual maturity of debt, as it flattens or steepens, and there are four possible scenarios here:
Source: LSEG Refinitiv data
- A bull flattener, when long-term yields (and interest rates) fall faster than short-term ones, so the yield spread shrinks. This is usually how markets discount interest rate cuts and can be seen as positive for bond prices (as yields fall) and share prices (as a recovery in profits, dividends and cash flow is anticipated). The longer the duration the more favourable it is, and this can include assets such as long-dated bonds and equity sectors with a big chunk of their earnings in the future, like technology and biotechnology.
- A bear flattener, when short-term yields rise faster than long-term ones, so the difference between the two again narrows. This is usually seen as a harbinger of recession, or at least interest rate hikes and tighter monetary policy, and is thus potentially negative for share prices, especially for areas like banks and cyclicals.
- A bull steepener, when short-term yields fall faster than longer-term ones, so the spread, or differential between them widens. This is usually seen when markets are pricing in interest rate cuts and is thus bullish for bonds and potentially equities, although if the steepening heralds an unexpected recession, then fixed-income investors may be happier than holders of shares.
- A bear steepener, when both short and long-term yields are rising but long-term ones are rising faster to widen the gap between the two. This can be bad news for bonds in particular, as prices fall when yields rise, and it can be a sign inflation is on the rise. It could be a challenge for share prices, too, as it combines higher discount rates (that lower the theoretical value of the long-term cash flows of long duration sectors like tech and biotech) with tighter monetary policy that hits the earnings power of short-duration, cyclical industries.

Written by:
Russ Mould
Investment Director
Russ Mould is AJ Bell's Investment Director. He has a Master's degree in Modern History from the University of Oxford and more than 30 years' experience of the capital markets.
Ways to help you invest your money
Put your money to work with our range of investment accounts. Choose from ISAs, pensions, and more.
Let us give you a hand choosing investments. From managed funds to favourite picks, we’re here to help.
Our investment experts share their knowledge on how to keep your money working hard.
Related content
- Tue, 17/12/2024 - 10:20
- Thu, 07/11/2024 - 11:00
- Wed, 06/11/2024 - 12:06
- Mon, 21/10/2024 - 16:26
- Wed, 09/10/2024 - 10:17