Archived article
Please note that tax, investment, pension and ISA rules can change and the information and any views contained in this article may now be inaccurate.
 magazine
How to assess the market cycle

This column has no axe to grind with Nvidia (NVDA:NASDAQ) and – like everyone else – it continues to be both surprised and impressed by the growth that the semiconductor specialist is generating, thanks to the competitive position it is crafting itself in providing silicon chips that power the data centres that, in turn, drive the large language models that are so important to the development of AI (artificial intelligence). The company’s first-quarter results (22 May) were phenomenal, the guidance for the second quarter to the end of July was better than expected and the share price has surged to new highs.
A bigger challenge is to assess the stock’s valuation, given how Nvidia’s market capitalisation of $2.6 trillion equates to 20 times this year’s forecast revenues and 40 times its forecast profits (even allowing for how estimates for both keep on rising). Another way to look at it is how any one who has $2.6 trillion in cash lying around can either buy Nvidia, with its forecast net profits of $64 billion this year, or buy all 40 of the companies in Germany’s DAX-40 index, where aggregate post-tax earnings are estimated to be $137 billion this year, and have $400 billion in change left over.
Only investors can decide for themselves whether Nvidia’s growth and share price momentum or the potential relative value offered by the German DAX fit with their overall strategy, time horizon, target returns and appetite for risk. But this valuation equation does once more raise the issue of investor psychology and market sentiment and how investors can best build their portfolios in their quest for the best risk-adjusted returns.
FOUR PHASES
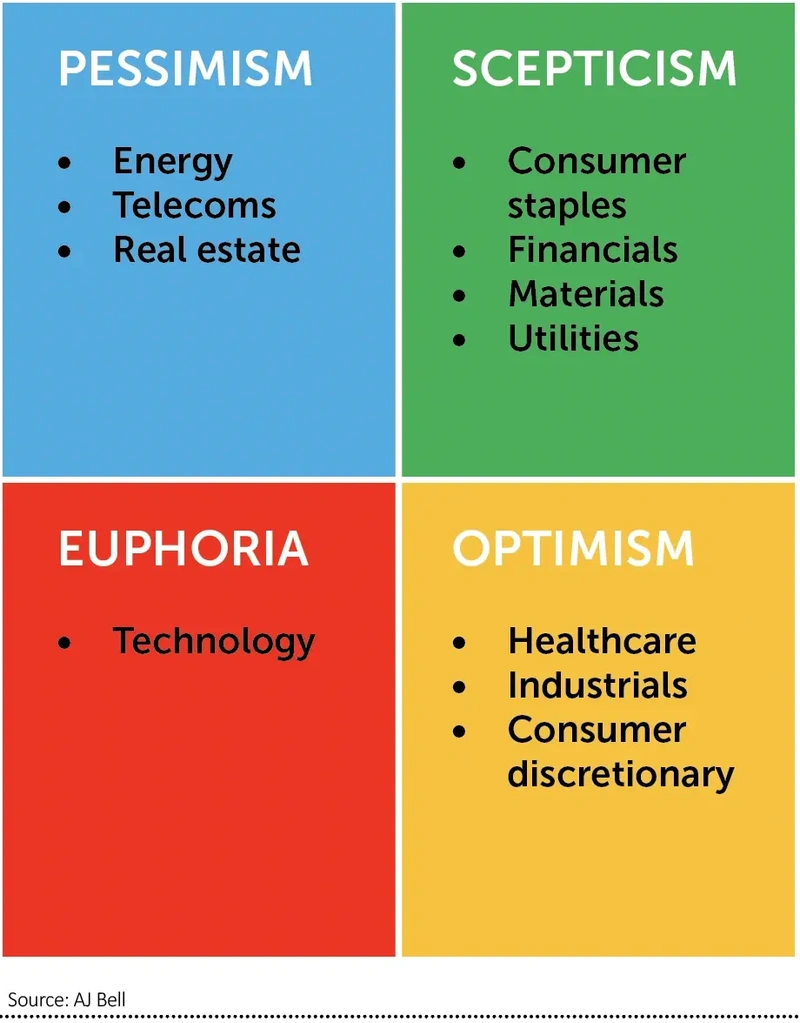
Regular readers will know that this column is a big fan of Sir John Templeton’s maxim that, ‘Bull markets are born on pessimism, grow on scepticism, mature on optimism and die on euphoria.’ The fund management legend’s point here was the pessimism means low valuations (and thus potentially limited downside and a lot of upside, providing a business model or industry is not irretrievably broken) and euphoria means lofty valuations (and thus less upside and potentially a lot of downside if something goes unexpectedly wrong).
One way of identifying which stocks, industries and equity markets lie in which of Sir John’s four phases of the market cycle can be achieved through the crude tool of share price and index performance.
Of the 11 super-sectors represented by the S&P Global 1200 equity indices, it will surprise no-one, given Nvidia’s gallop higher, that Technology is the best performer over the last year. Telecoms is second, thanks to Alphabet (GOOG:NASDAQ), Meta Platforms (META:NASDAQ) and Netflix (NFLX:NASDAQ), while Financials is third, buoyed by Berkshire Hathaway (BRKA:NYSE), JP Morgan Chase (JPM:NYSE), Visa (V:NYSE) and Mastercard (MA:NYSE).
Tech and telecoms are the top performing sectors over the past year
ALL-TIME HIGHS
A different way to assess a sector’s popularity, and whether it may be unloved and potentially cheap or overloved and possibly expense, is to look at how far away it trades (if at all) from its all-time index high. Again, Technology trades at its highest mark ever and, intriguingly, Healthcare, Industrials, Consumer Staples and even Financials are not far away.
Three of 11 global industry indices set an all-time high in May
Two other trends catch the eye. One is how long it has taken certain industry sectors to get back to prior peaks, most notably Financials and Utilities, in what could perhaps be a veiled warning against irrational exuberance in what are the most popular sectors today.
How Templeton’s four market phases could be interpreted right now
The other is the identity of those sectors which remain in the doldrums, notably Real Estate, Telecoms and Energy. Investors of a contrarian inclination may be tempted to do further research here, perhaps in the view that there may be value to be had.
Energy demand continues to rise and there remains the possibility that oil and gas will be required for longer than we would like to assume, while Real Estate is very sensitive to interest rates – the UK property sector, for example, shot up like a rocket in 1993 in the wake of Black Wednesday when sterling’s ejection from the Exchange Rate Mechanism in autumn 1992 permitted the then chancellor, Norman Lamont, to cut the headline cost of borrowing.

Important information:
These articles are provided by Shares magazine which is published by AJ Bell Media, a part of AJ Bell. Shares is not written by AJ Bell.
Shares is provided for your general information and use and is not a personal recommendation to invest. It is not intended to be relied upon by you in making or not making any investment decisions. The investments referred to in these articles will not be suitable for all investors. If in doubt please seek appropriate independent financial advice.
Investors acting on the information in these articles do so at their own risk and AJ Bell Media and its staff do not accept liability for losses suffered by investors as a result of their investment decisions.
Issue contents
Editor's View
Feature
Great Ideas
News
- Watches of Switzerland shares fall on flagging demand for luxury goods
- AI chip champ Nvidia adds $230 billion in a day
- AstraZeneca shoots for the stars, GSK wins first Zantac trial and PureTech Health launches tender at a premium
- What will a general election mean for the markets and the economy?
- Seraphim chimes once again with investors
- Why Marks & Spencer can maintain its momentum
- Pressure mounts on cybersecurity hot stock Crowdstrike