Archived article
Please note that tax, investment, pension and ISA rules can change and the information and any views contained in this article may now be inaccurate.
 magazine
UK's hottest funds: Is their popularity deserved?

Funds can often be in vogue with investors thanks to a big-name manager or a past reputation, but just how well-earned is the popularity of the UK’s most popular funds and investment trusts?
In this article we’ve taken a look at the performance of a select group of funds which regularly feature among the most bought and most widely-held in the market to judge whether they are truly delivering the goods.
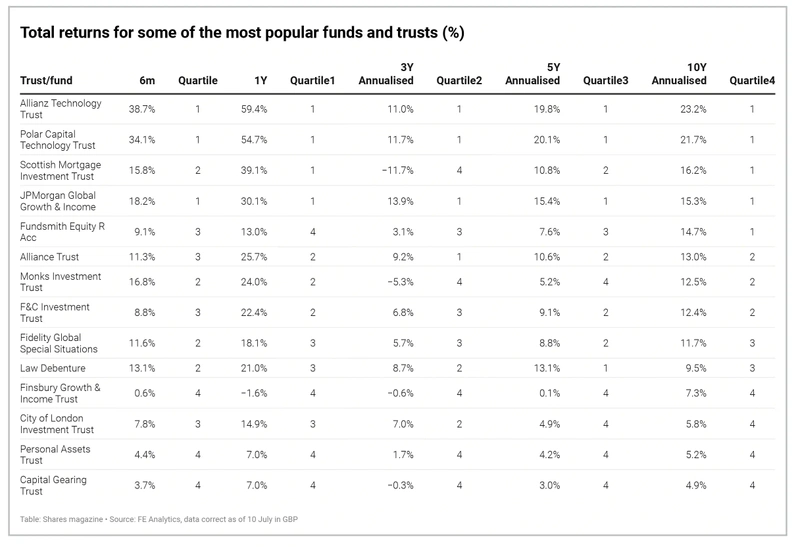
The table shows our selection, their annualised returns over one, three and five years and which quartile they sit in. As a reminder, quartile rankings provide a measure of how well a fund has performed against all other funds in its category, with rankings ranging from ‘Top Quartile’, often referred to as ‘First Quartile’, to ‘Fourth Quartile’ or ‘Bottom Quartile’, over various time periods.
Put simply, if a given fund category has 100 funds each quartile will be made up of 25 funds. The 25 funds with the highest returns will belong to the top or first quartile, while the next best 25 funds will inhabit the second quartile and so on.
We discuss some of the names at either extreme performance-wise in more detail below, looking at three whose long-term performance still stacks up, two which have struggled of late and two which have underperformed even on a decade-long view.
The emphasis on how managers have done over the long run is important though. All stock pickers will underperform at some point, what’s important is they remain true to their process and don’t fall victim to ‘style drift’ when it’s not working.
THE LEADERS OF THE PACK
Allianz Technology Trust (ATT) 406p
Market cap: £1.55 billion
Polar Capital Technology Trust (PCT) £34.35
Market cap: £4.1 billion
THESE TWO SPECIALIST investment trusts are arguably retail investors’ easiest route into the exciting technology space without buying individual stocks, an area which has come to dominate growth generation and many portfolios’ asset allocation.
That AI (artificial intelligence) chip champion Nvidia (NVDA:NASDAQ) is the largest holding for both is a major reason why the share prices of Allianz Technology Trust (ATT) and Polar Capital Technology Trust (PCT) have rallied hard this year, up 35% and 34% respectively year-to-date.
Both aim to capture structural technology growth themes through their stock selection, things like AI, cloud computing, cybersecurity, online commerce and much else, although there are differences.
Polar has a larger portfolio (about 100 stocks) whereas Allianz is more concentrated, typically owning around 40 companies, which gives retail investors the choice of greater diversification or heightened exposure to tech winners, depending on your preference.
With the discount to NAV (net asset value) of both trusts still trailing 15% to 20% below their long-run averages there is scope for further re-rating, potentially driving strong share prices gains through the rest of 2024 and beyond as underlying portfolio valuations rise driving discounts to narrow. [SF]
DISCLAIMER: The author owns shares in Allianz Technology Trust and Polar CapitalTechnology Trust.
JPMorgan Global Growth & Income (JGGI) 582p
Market cap: £2.8 billion
THERE AREN’T MANY investment trusts trading at a premium to NAV (net asset value), but as of last week shares in JPMorgan Global Growth & Income (JGGI) were priced 1.1% above the value of the portfolio.
This is partly down to the trust’s popularity and partly due to the managers’ track record of successfully picking winning stocks using their high-conviction, bottom-up research process.
Five of the top 10 stocks are members of the ‘Magnificent Seven’ – Amazon.com (AMZN:NASDAQ), Apple (AAPL:NASDAQ), Meta Platforms (META:NASDAQ), Microsoft (MSFT:NASDAQ) and Nvidia.
As of the end of May, these five holdings accounted for over quarter of the portfolio, making the trust another way to play the AI (artificial intelligence) theme.
Demand for shares – not just from retail investors but also from large wealth managers – has been so strong this year the trust has been issuing new stock at a premium to NAV.
Also, as it grows, it becomes a natural ‘home’ for other funds, not just internally (it is in the process of absorbing JPMorgan Multi-Asset Growth & Income (MATE)) but also externally where trustees are looking for a change of manager, as was the case with Scottish Investment Trust. [IC]
CAPABLE OF DOING BETTER
Scottish Mortgage (SMT) 905p
Market cap: £11.55 billion
SHARES IN THE EVER-POPULAR growth fund have staged a modest recovery this year as talk of interest rate loosening has bolstered risk appetite, but it may take that rate cut talk to turn into action to power a further rally with the market largely tagging September for the US Fed’s first move.
For most of this century, long-term investors have backed Scottish Mortgage (SMT) to the hilt, enjoying a string of successes, including stakes in Amazon, Tencent (0700:HKG) and Tesla (TSLA:NASDAQ) long before the rest of the market caught on.
It is a run which has made Scottish Mortgage a foundation stone of thousands of private investor portfolios, powering the trust into the FTSE 100.
During the three years to 31 December 2023, the shares lost 32.8%, according to manager Baillie Gifford, versus a 28.7% gain for its FTSE All World Index benchmark, and even lead managers Tom Slater and Lawrence Burns admit the trust is not for everyone.
A big part of that underperformance came from Scottish Mortgage’s appetite for owning stakes in private companies, which are notoriously difficult to value especially during dry spells for funding rounds and an IPO (initial public offering) drought.
In a bid to narrow the discount to net assets the trust announced a £1 billion share buyback, but clearly there is work still to do – the discount is currently 9.2% against a long-run average of 6%. [SF]
Disclaimer: The author owns shares in Scottish Mortgage.
Fundsmith Equity (B41YBW7) 707p
Market cap: £22.7 billion
FROM ITS INCEPTION in 2010 to the end of 2023, Fundsmith Equity (B41YBW7) has racked up a cumulative gain of 550%, meaning if you had invested £10,000 on day one, by last Christmas you would be sitting on £65,000.
If you had put your £10,000 in an MSCI World tracker instead, you would still have done nicely but your pot would be £43,167, and if you had bought bonds it would be worth just £12,800.
On a one-, three- and five-year view though, while it has still made money for investors, the fund has struggled to keep up with its benchmark.
The obvious reason for this, particularly over the last 12 months, is the dominance of the ‘Magnificent Seven’, which to illustrate the point powered 46% of the advance in the MSCI World index in the first half of 2024 with Nvidia alone accounting for 25% of the gains.
While the managers are happy owning Apple, Meta Platforms and Microsoft, they have side-stepped Nvidia as they aren’t convinced the outlook is as predictable as they would like.
As the fund’s Owner’s Manual says, short-term comparisons aren’t very helpful and even a year is too short a time to measure performance as it doesn’t reflect the business cycle. [IC]
Disclaimer: The author owns shares in Fundsmith Equity.
BOTTOM OF THE PILE
Capital Gearing Trust (CGT) £46.90
Market cap: £977.7 million
CAPITAL GEARING TRUST (CGT) boasts a strong long-run record of protecting shareholders’ funds, having delivered an NAV (net asset value) total return of more than double the rise in the consumer price index (CPI) over the 10 years to March 2024.
The wealth preservation specialist has disappointed more recently, however, with bottom-quartile performance over one, three and five years due to an overly-cautious stance on equities as global stock markets roared higher.
In the year to 31 March 2024, the fund delivered a muted 1.8% NAV (net asset value) total return which was ‘far from satisfactory’ according to managers Peter Spiller, Alastair Laing and Chris Clothier given CPI’s 3.2% rise and the MSCI AC World’s 21% advance over the same period.
The managers remain wary of valuations in the US, particularly mega-cap tech, but see exceptional value in investment trusts where they have increased the fund’s exposure with wide discounts meaning the outlook for trusts is ‘the most attractive that it has been for years’.
On the plus side, Capital Gearing’s ultra-diversified multi-asset portfolio, which includes exposure to index-linked bonds, should offer protection in the event of future market shocks.
Moreover, share buybacks, which were temporarily restricted last year due to an administrative error, should ensure the 1.9% discount doesn’t widen from here. [JC]
Finsbury Growth & Income Trust (FGT) 843p
Market cap: £1.48 billion
Another popular trust now showing fourth-quartile performance over one, three and five years is Nick Train’s Finsbury Growth & Income (FGT), a concentrated portfolio of quality growth companies, which have encountered stiff headwinds amid high inflation and rising interest rates.
Despite significant share buybacks, the trust’s discount has widened beyond the board’s 5% target, standing at 8% at the time of writing.
Train, who uses a bottom-up stock-picking approach to find ‘excellent companies that appear mostly undervalued’, has apologised to shareholders for three years and more of underperformance.
Returns have lagged the benchmark FTSE All-Share as sizeable holdings such as Diageo (DGE) and Burberry (BRBY) have dragged on performance along with the absence of oil or mining shares and the fund’s insufficient exposure to technology or companies well-positioned to exploit technology.
However, Train believes there is ‘tremendous value building in the portfolio’ and has increased exposure to companies with first-class data or technology assets by adding new holdings such as Experian (EXPN), Rightmove (RMV) and Fevertree Drinks (FEVR:AIM), while upping exposure to data, analytics and software companies already in the portfolio.
Falling inflation and rate cuts would be a tailwind for Finsbury Growth & Income, which as Investec notes, delivered spectacular performance between 2008 and 2020 with a NAV total return CAGR (compound annual growth rate) of 14.4% versus a benchmark total return CAGR of just 5.1%. [JC]

Important information:
These articles are provided by Shares magazine which is published by AJ Bell Media, a part of AJ Bell. Shares is not written by AJ Bell.
Shares is provided for your general information and use and is not a personal recommendation to invest. It is not intended to be relied upon by you in making or not making any investment decisions. The investments referred to in these articles will not be suitable for all investors. If in doubt please seek appropriate independent financial advice.
Investors acting on the information in these articles do so at their own risk and AJ Bell Media and its staff do not accept liability for losses suffered by investors as a result of their investment decisions.
Issue contents
Feature
Great Ideas
News
- Shares in drinks firm Diageo hit three-year lows as sales stagnate
- Capita shares rally 40% following strategic rethink and software sale
- Weaker-than-forecast second-quarter GDP adds to pressure on Chinese leaders
- Burberry shares tumble to 10-year low on latest profit warning
- US bank results highlight divide between Wall Street and Main Street